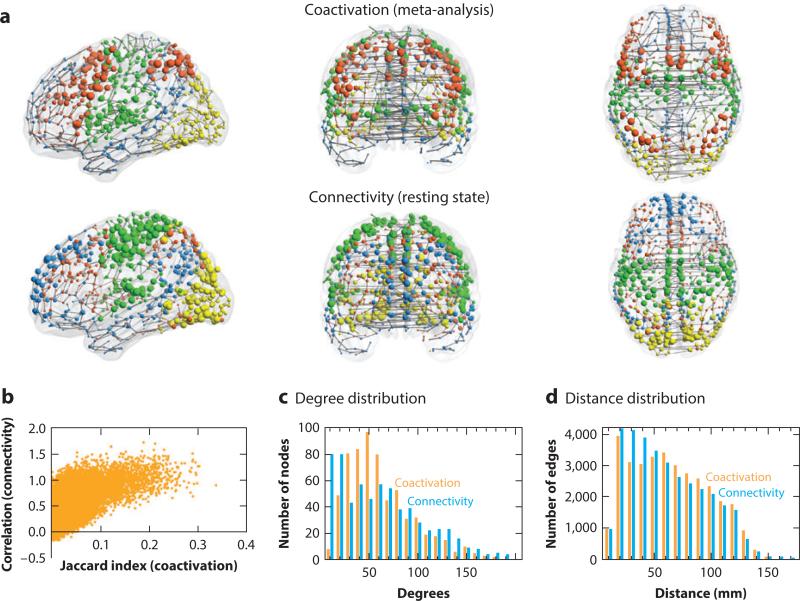
Figure 6.
Topological analysis. The comparability of topological networks derived from meta-analysis of the BrainMap database (top row) and resting-state fMRI in 27 subjects (middle row) is illustrated. In anatomical space (a, upper two rows) the size of the nodes is proportional to their weighted degree (strength), and their color corresponds to module membership. The relationship between the coactivation metric (Jaccard index; b) and the connectivity metric for every pair of regions is graphed (b). The degree and distance distributions for both networks are plotted (c and d, respectively). Images are reproduced with permission from Crossley et al. (2013).

