FIGURE 3.

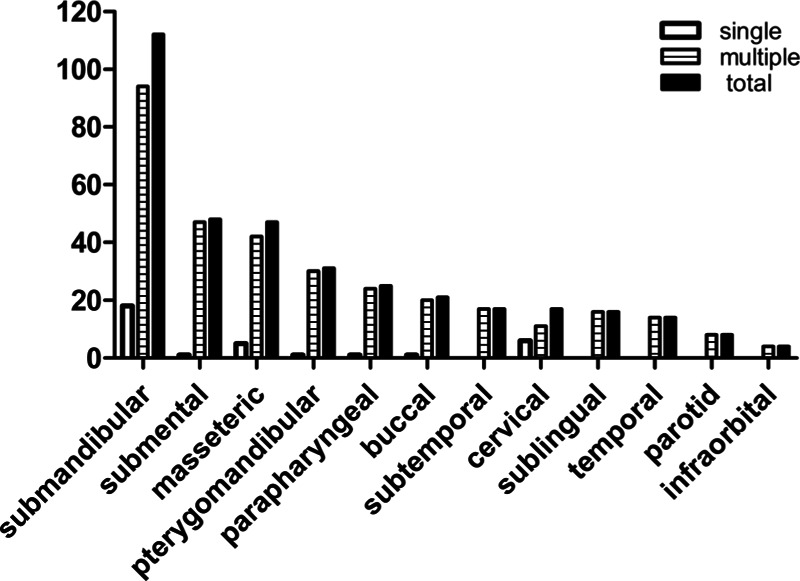
Distribution of maxillofacial spaces involved (n = 127). The figure described the proportion of each maxillofacial space in single-space infection, multiple-space infection, and the total maxillofacial space infection.

Distribution of maxillofacial spaces involved (n = 127). The figure described the proportion of each maxillofacial space in single-space infection, multiple-space infection, and the total maxillofacial space infection.