
Figure 3.
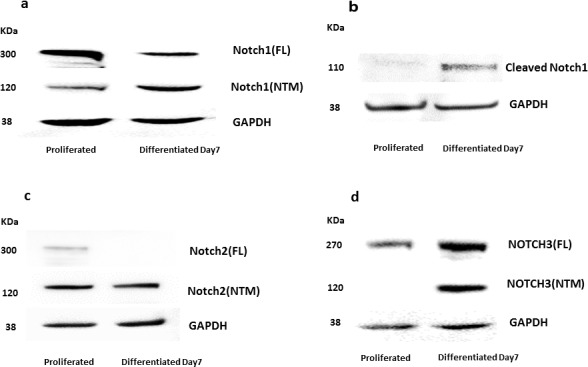
Protein expression of Notch1, cleaved Notch1, Notch2, and Notch3 under proliferative and differentiative culture conditions. By Western blot analysis (a) the Notch1 full length (FL) domain decreased with differentiation while the NTM domain increased. (b) Cleaved Notch1 was found to increase with differentiation. (c) The FL domain of Notch2 was weakly expressed under proliferative conditions while its NTM domain increased slightly with differentiation, (d) The FL domain of Notch3 was higher under differentiative condition while its NTM domain was not expressed under proliferative conditions.