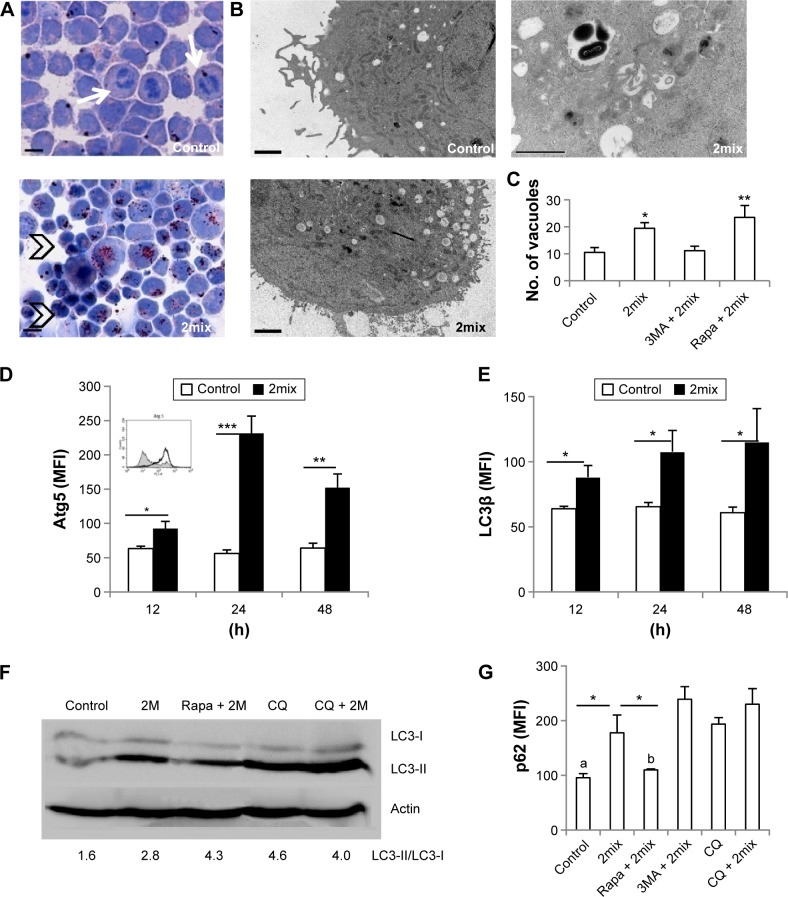
Figure 1.
Exposure to a mixture of 7-oxysterols (2mix) causes lipid accumulation and autophagy dysfunction. THP-1 monocytes or THP-1 differentiated macrophages were treated with or without 2mix for 12 hours to 48 hours. In some experiments, cells were pretreated with the autophagy inhibitor 3MA or the autophagy inducer rapamycin for 1 hour and then exposed to 2mix or treated with the lysosomatropic agent CQ for 24 hours or CQ for 1 hour and 2mix for 24 hours. (A) Oil red O-stained THP-1 monocytes counterstained with hematoxylin (24 hours), bars = 100 µm. (B and C) Accumulation of autophagy vacuoles in THP-1 differentiated macrophages assayed by TEM and quantified by image analysis. (B) Photographs of low power view of control and 2mix-treated cells (two photographs on the left-hand side), bars = 2 µm or a higher magnified photograph (photograph on the top right-hand side) demonstrates autophagic vacuoles with double-membrane structure containing undigested cytoplasmic materials, bar = 1 µm. (C) Quantification of numbers of autophagic vacuoles, *P < 0.05, **P < 0.01 versus control and 3MA + 2mix, respectively. (D) Atg5-immunostained THP-1 monocytes analyzed by flow cytometry. n = 6–8, *P < 0.05, **P < 0.01 and ***P < 0.001. The inset shows a representative histogram of flow cytometry results (control: gray field histogram; 2mix: black-lined empty histogram). (E) LC3β-immunostained THP-1 monocytes analyzed by flow cytometry; n = 6–20, *P < 0.05. (F) Western blot analysis of LC3 I/II in the whole cell lysate of THP-1 monocytes. Values mentioned below the Western blot image are the ratios of LC3-II to LC3-I. (G) p62/SQSTM1-immunostained THP-1 monocytes analyzed by flow cytometry; n = 3–4. aP < 0.05 vs CQ and P < 0.01 vs 3MA + 2mix and CQ + 2mix. bP < 0.05 vs CQ and P < 0.01 vs CQ + 2mix and P < 0.001 vs 3MA + 2mix. *P < 0.05.

