Figure 3.
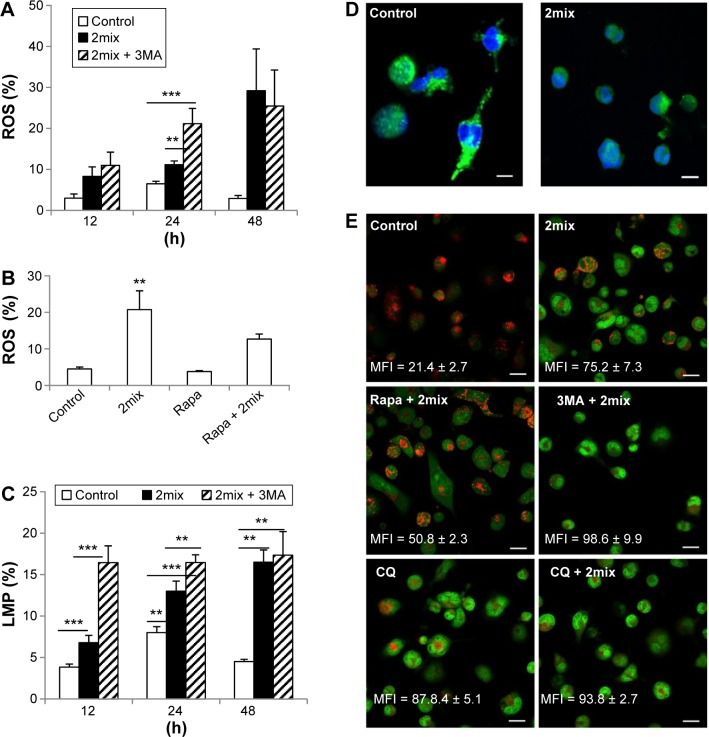
Up- and downregulation of autophagy regulates oxidative stress and LMP induced by 7-oxysterols. THP-1 cells were treated with 2mix for different time periods (A and C) or for 48 hours (B) or for 12 hours (D) or pre-treated with 3MA (A) or rapamycin (B) for 1 hour and then exposed to 2mix. The cells were then collected, stained with DHE for ROS (A and B) with lysotracker (C) or immunostained for cathepsin D (D) for LMP. In some experiments (E), LMP was monitored by AO relocation test. In this setting, THP-1 differentiated macrophages were stained with AO first and then subjected to different treatments for 6 hours, followed by fluorescence microscopy. (A) Autophagy inhibition by 3MA enhances cellular ROS induced by 2mix (n = 6–12, **P < 0.01 and ***P < 0.001). (B) Autophagy induction by rapamycin suppresses cellular ROS induced by 2mix (n = 5–6, **P < 0.01 vs control and rapamycin alone). (C–E) Both autophagy inhibition and lysosomal accumulation of CQ enhances LMP. (C) Quantification of LMP by flow cytometry following lysotracker staining, n = 4–10, **P < 0.01 and ***P < 0.001. (D) Cytosolic release of cathepsin D by 2mix (12 hours).
Notes: Most control cells show a typical lysosomal granular pattern of cathepsin D marked in green (nuclei marked in blue), while most 2mix-treated cells exhibit a cytosolic diffuse pattern, bars = 10 µm. (E) LMP assayed by AO relocation test. Control cells show bright lysosomal red and low cytosolic/nuclear green fluorescence, indicating intact lysosomal membranes, while cells treated with 2mix show bright cytosolic/nuclear green and less lysosomal red fluorescence, indicating LMP and relocation of AO from lysosomes to cytosol and nuclei. Rapamycin pretreatment preserved lysosomal red fluorescence and decreased cytosolic/nuclear relocation of AO induced by 2mix, while 3MA enhanced 2mix-induced LMP. LMP was also observed following CQ exposure. AO green fluorescence intensity mean fluorescence intensity (MFI) was measured by Photoshop image analysis and presented in each photograph (mean ± SEM), bars = 20 µm.

