
FIGURE 3.
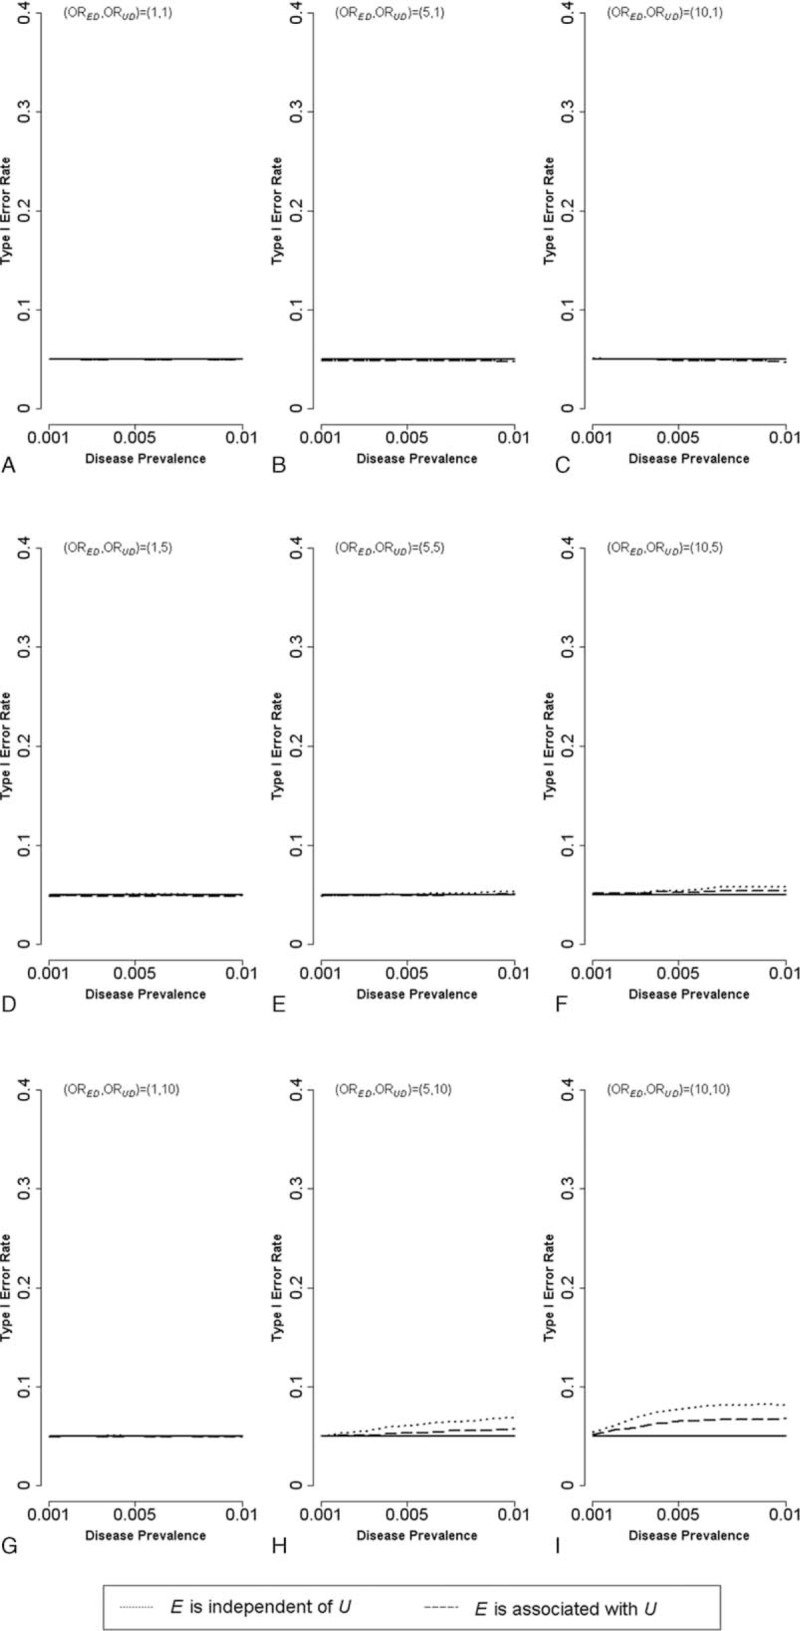
Type I error rate for the gene–environment interaction in case-control studies with small sample size (n = 500) [A:(ORED, ORUD,) = (1,1); B:(ORED, ORUD,) = (5,1); C:(ORED, ORUD,) = (10,1); D:(ORED, ORUD,) = (1,5); E:(ORED, ORUD,) = (5,5); F:(ORED, ORUD,) = (10,5); G:(ORED, ORUD,) = (1,10); H:(ORED, ORUD,) = (5,10); I:(ORED, ORUD,) = (10,10); dotted lines: E is independent of U; dashed lines: E is associated with U]. OR = odds ratio.