
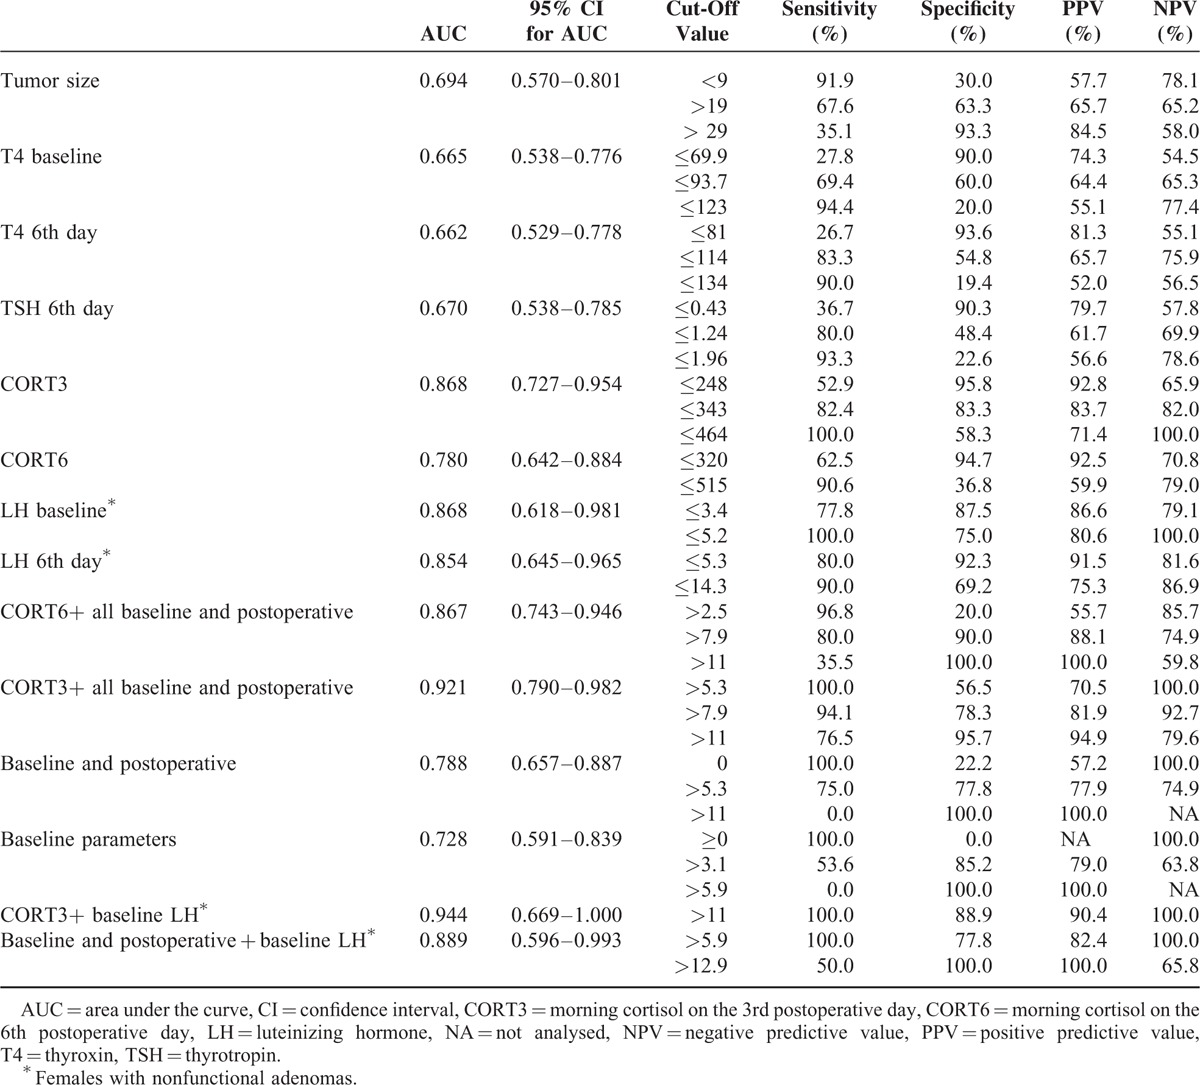
TABLE 2.
Results of ROC Analysis Showing the Sensitivity, Specificity, Positive, and Negative Predicitive Values for Each Cut-Off Value of the Variable
Official websites use .gov
A
.gov website belongs to an official
government organization in the United States.
Secure .gov websites use HTTPS
A lock (
) or https:// means you've safely
connected to the .gov website. Share sensitive
information only on official, secure websites.
Results of ROC Analysis Showing the Sensitivity, Specificity, Positive, and Negative Predicitive Values for Each Cut-Off Value of the Variable