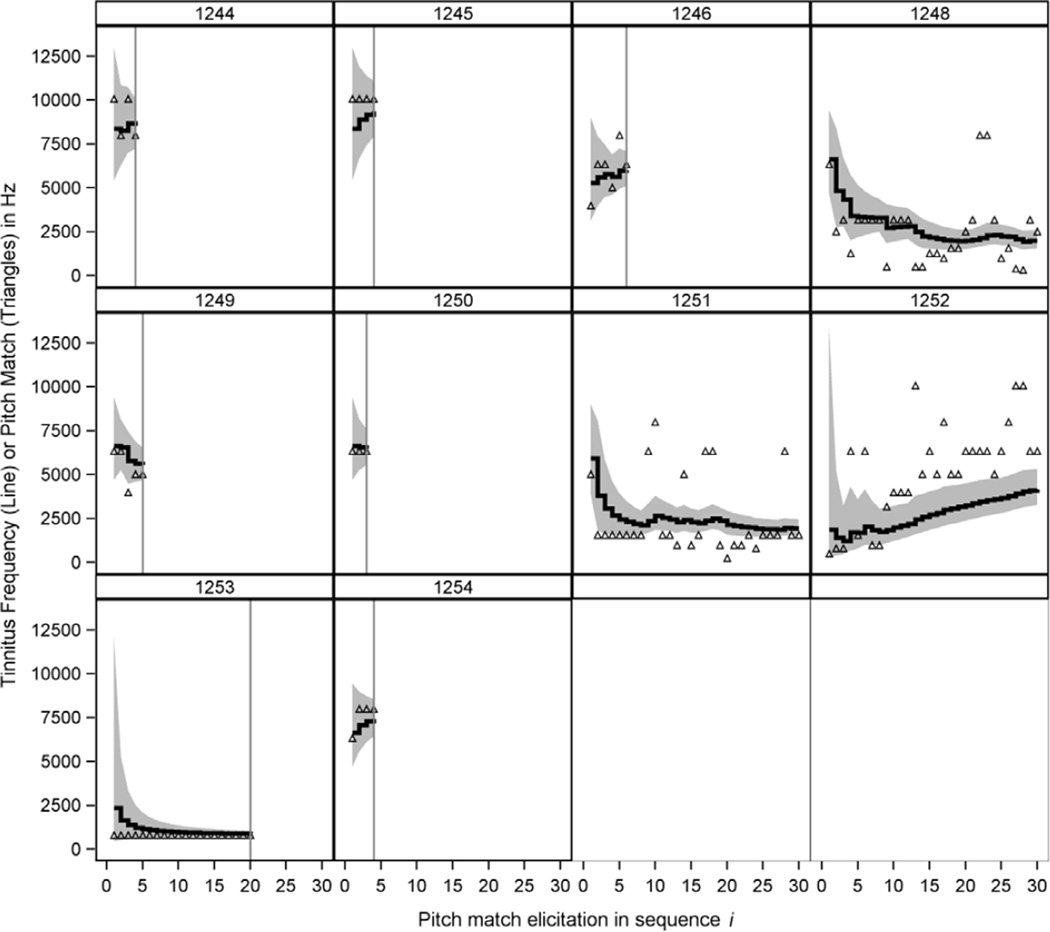
Fig. 2.
Posterior estimates of tinnitus frequency (solid lines) and 90% Bayesian credible intervals (shaded region) for 10 subjects. Open triangles show the pitch match results at each test ordered on the x-axis. Vertical reference lines are stopping points when the subject’s tinnitus frequency was estimated to within one-quarter octave with 90% certainty. Panel headers correspond to subject numbers in Table 2.

