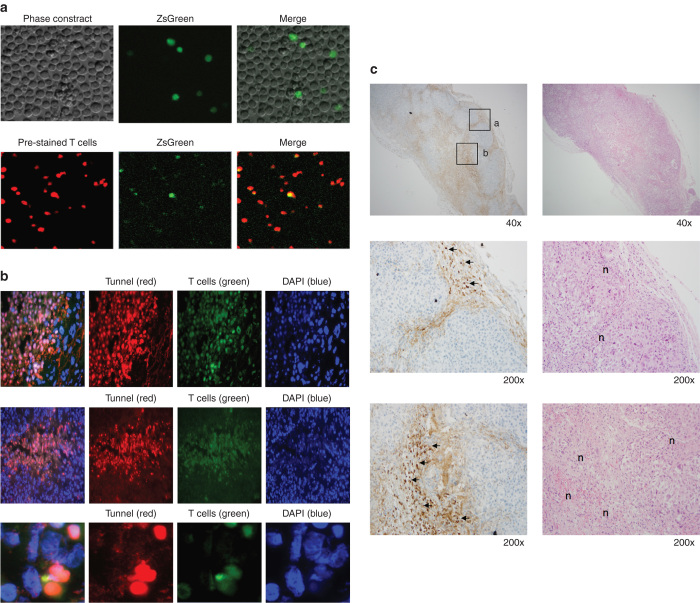
Figure 6.
In vivo antitumor activity of chimeric antigen receptor (CAR+) T-cells. (a) Expression of ZsGreen by CART cells is shown in the upper panel. CART cells were prestained with Far Red dye, cytospun and examined by fluorescent microscopy (lower panel). (b) In situ staining of G36 CD28 CART cells in regressing tumor. CART-cells were intravenously injected into renal cell carcinoma established mice and tumor tissue was collected on day 1–3. Confocal microscopy was used to measure apoptosis of tumor cells by TUNNEL assay with PE-Cy5 dye (shown as red). Transduced T cells were shown by ZsGreen. Nuclei were counterstained with DAPI. Two representative slides were shown to indicate the apoptosis of tumor cells at the edge of tumor (upper panel) and inside the tumor bed (middle panel), respectively. The magnified image (lower panel) demonstrates CART cells interacted with multiple tumors while a few surrounding tumor cells were dying (left column, merged staining). (c) Granzyme B+ T cells and tumor necrosis. After the treatment with CART cells, the regressing CAIX+ sk-rc-52 tumors were stained by granzyme B antibody (brown) and H&E. The higher magnification view (middle and lower panels of sections a and b in upper panel) shows the locations of granzyme B+ T cells (shown by arrows) and the corresponding H&E slide shows the tumor necrosis (shown by n). Granzyme B+ T cells are distributed at the edge of tumor (middle panel) and inside the tumor (lower panel).

