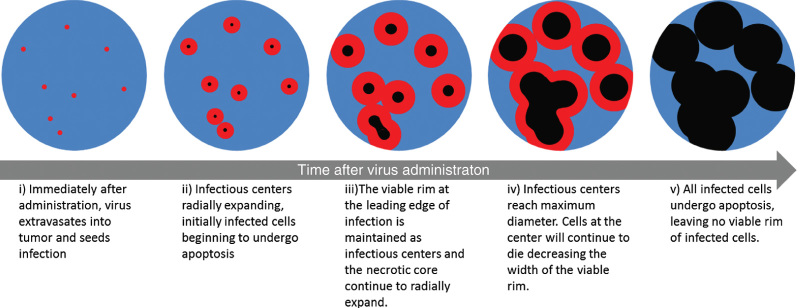
Figure 1.
Diagrammatic illustration of the progression in intratumoral oncolytic virus infection. The stages of infection depicted here correlate with the changes in radiotracer uptake concentration that is detected with autoradiography and microSPECT/computed tomography (CT) imaging analysis. (i) Multiple infectious centers (red) are seeded throughout the tumor (blue). (ii) Each infectious center expands radially as the infection spreads outward. After ~20 hours, infected cells at the core of the infectious center begin to die (black) leaving a rim of viable infected cells that correlate with maximum radiotracer uptake. (iii) As infection continues to spread, the infectious centers continue to enlarge but the rim of viable cells is maintained. Centers of infection coalesce to form large regions of infection. (iv) Infection reaches its maximum spread and (v) all infected cells die, corresponding to loss of radiotracer uptake.

