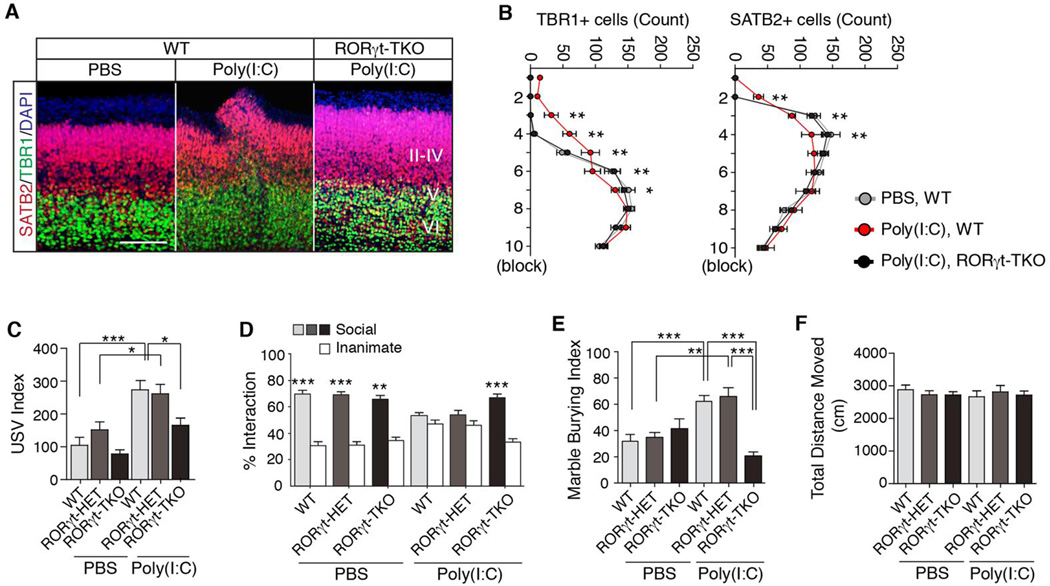
Fig. 4. RORγt expression in maternal T cells is required for manifestation of ASD-like phenotypes in the MIA model.
(A) SATB2 and TBR1 staining in the cortex of E18.5 fetal brains following MIA induction with poly(l:C) in mothers with the indicated genotypes. II–IV, V and VI refer to different cortical layers. Images are representative of three independent experiments. Scale bar represents 100 µm. (B) Quantification of TBR1 and SATB2 positive cells in a 300×300 µm2 ROI centered on the malformation in the cortical plate of E18.5 male fetal brains (n = 6 (PBS, WT), n = 6 (Poly(l:C), WT), n = 6 (Poly(l:C), RORγt-TKO)). (C) Number of ultrasonic vocalizations (USV)s emitted by P9 pups. Total USVs emitted during test period (3 min) are plotted on the y-axis (n = 16,18 and 15 offspring from PBS-treated WT, RORγt HET and RORγt TKO mothers; n = 15,11 and 28 from poly(l:C)-treated WT, RORγt HET and RORγt TKO mothers); data from 4–7 independent dams. (D) Social approach behavior is graphed as a social preference index (% time spent investigating social or inanimate stimulus/ total exploration time for both objects), (n = 21, 15 and 15 adult offspring from PBS-treated WT, RORγt HET and RORγt TKO mothers; n = 36,15 and 21 from poly(l:C)-treated WT, RORγt HET and RORγt TKO mothers); data from 4–7 independent dams. (E) Marble burying behavior is graphed as the percentage of buried marbles, (n = 14,19 and 15 adult offspring from PBS-treated WT, RORγt HET and RORγt TKO mothers; n = 32,15 and 25 from poly(l:C)-treated WT, RORγt HET and RORγt TKO mice per group); data from 4–7 independent dams. (F) Total distance moved by offspring tested for social behavior and marble burying. RORγt HET and RORγt TKO refer to RORγNeo/+; CD4-Cre/+ and RORγtFL/RORγNeo; CD4-Cre/+, respectively. (C) One-way ANOVA with Holm-Sidak post-hoc tests. (B and D) Two-way ANOVA with Tukey post-hoc tests. (E and F) One-way ANOVA with Tukey post-hoc tests. ***P <0.001, **P < 0.01 and *P < 0.05. Graphs show mean ± SEM.

