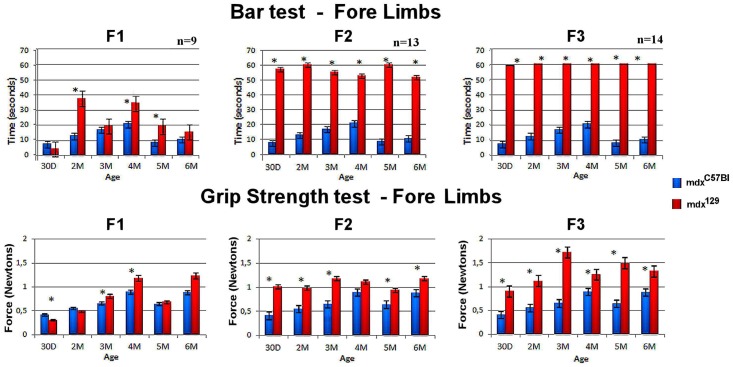
Fig 2. Graphical representation of comparative functional test in the mdxC57Bl as compared to the three mdx129 generations.
Data of the fore limbs in the bar test and grip strength test are shown with the median expression and standard error range for each age/strain. The number of tested animals in each generation is also presented. * p<0,05.

