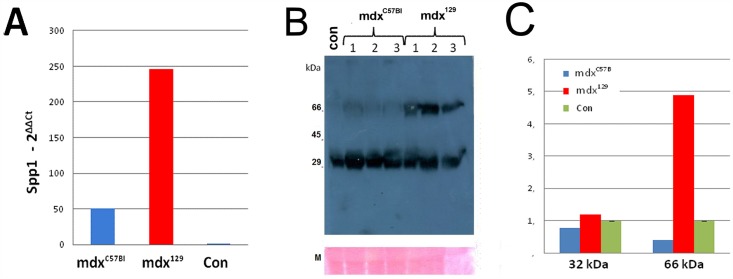
Fig 8. Quantification of Spp1 transcript and OPN protein expression.
(A) Fold changes in qPCR relative expression levels of osteopontin mRNA, as compared to the control group (129/Sv). (B) Western blotting analysis for OPN protein showing both the full length protein (66 kDa band) and one fragment of 32 kDa (cleaved product) in mdxC57BL and mdx129 as compared to normal control 129/Sv (con); M—myosin band. (C) Western blotting quantification showing the mean of each group for the band of 32 kDa and 66 kDa. An increase of 4,8 times of the 66 kDA band is observed in the mdx129 group using myosin band as a protein loading control.

