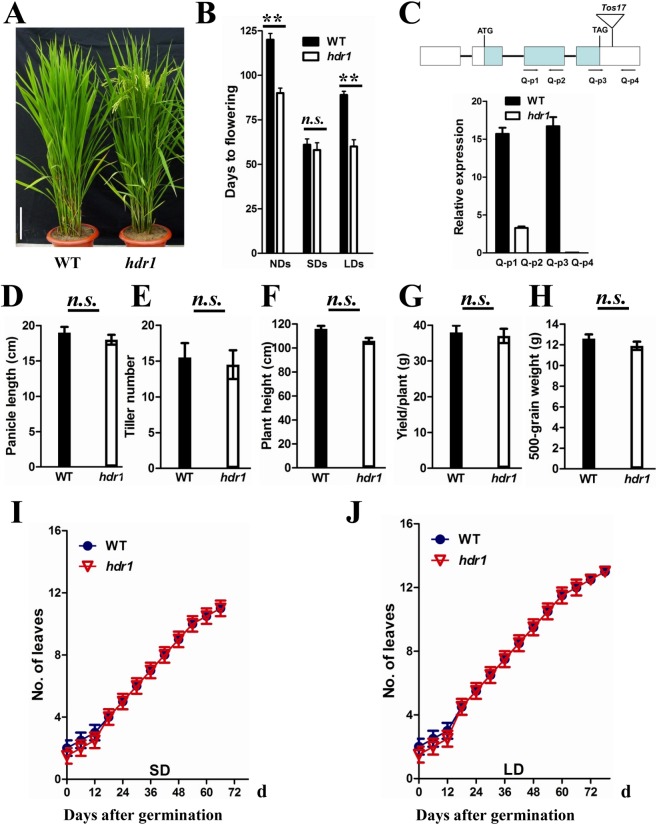
Fig 1. Phenotypes of the hdr1 mutant.
(A) The early flowering phenotype of hdr1 mutant in a paddy field (right). The Nipponbare WT (left). Bar = 20 cm. (B) Flowering time of hdr1 and WT plants under different day-length conditions (n = 12). NDs, natural day conditions; SDs, short day conditions; LDs, long day conditions. (C) mRNA expression analysis of HDR1 using real-time PCR in WT and hdr1 mutant. Mean values ±s.d. were obtained from three technical replicates and two biological replicates. (D) to (H) Comparisons of plant height, tilling number, panicle length, 500-grain weight, and yield per plant between WT and hdr1 plants. The values presented are the mean ± s.d. (n = 15). Double asterisks indicate statistically significant differences in the means between WT and hdr1 according to a two-tailed Student’s t test (p<0.01), and n.s. indicates no significant difference. (I) and (J) hdr1 plants had the same leaf-emergence rate as WT under both SDs and LDs. The values presented are the mean ± s.d. (n = 12). s.d.: standard deviations.

