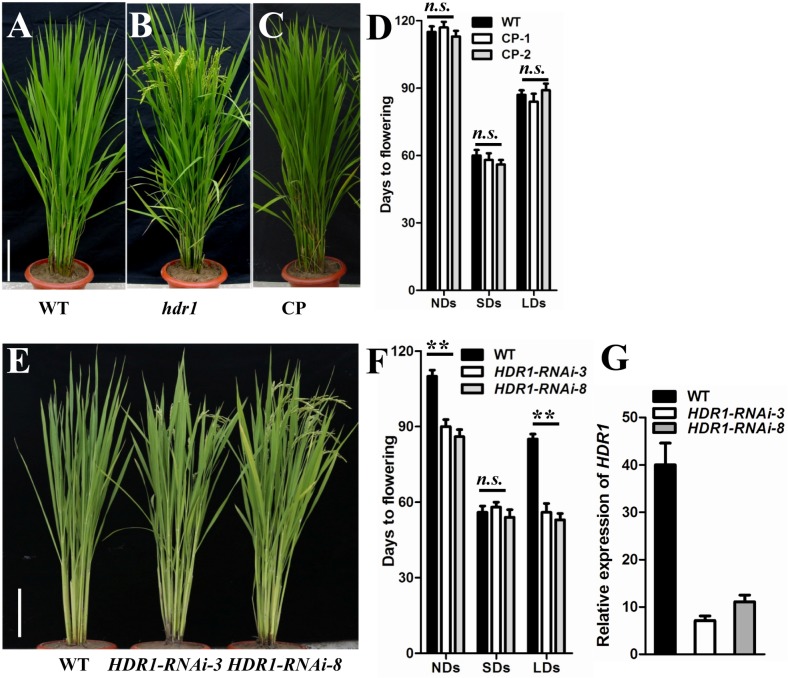
Fig 2. HDR1 controls rice flowering time.
(A) to (C) Complementation of hdr1 in a paddy field. A, wild type; B, hdr1 mutant; and C, complemented transgenic plant (CP). Bar = 20 cm. (D) Flowering time in WT and Complemented plant of transgenic lines 1 and 4 under NDs, SDs and LDs. The values presented are the mean ± s.d. (n = 12). (E) The phenotype of HDR1-RNAi plants in a paddy field. WT, left; line 3, middle; and line 8, right. (F) HDR1-RNAi plants exhibited early flowering under both NDs and LDs. The values presented are the mean ± s.d. for each of 12 independent plants of transgenic lines 3 and 8. (G) Real-time PCR analysis of HDR1 mRNA levels in WT and RNAi seedlings; Transgenic lines 3 and 8 were used. Mean values ± s.d. were obtained from three technical replicates and two biological replicates. s.d.: standard deviations.

