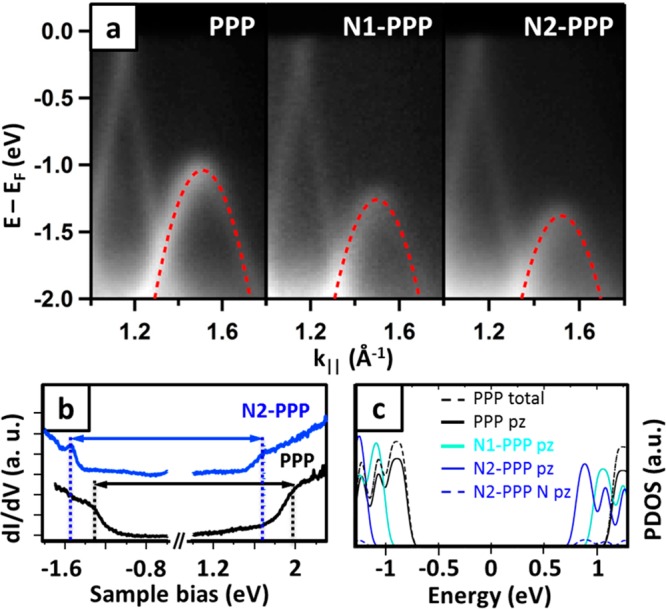
Figure 6.

Doping level-dependent electronic properties. Panel (a) reports the ARPES spectra of the different polymers at k∥ close to the VBM. The superimposed red-dashed lines are the parabolic fit of the band revealing an effective mass of m* = 0.19 m0; (b) STM dI/dV spectroscopy performed on PPP and N2-PPP, black and blue spectra, respectively; (c) computed projected densities of states (PDOS) of the different polymers. Total and pz projected density of states are compared for PPP, and nitrogen-related pz is additionally disclosed for N2-PPP to underline the negligible contribution of N to valence and conduction bands.
