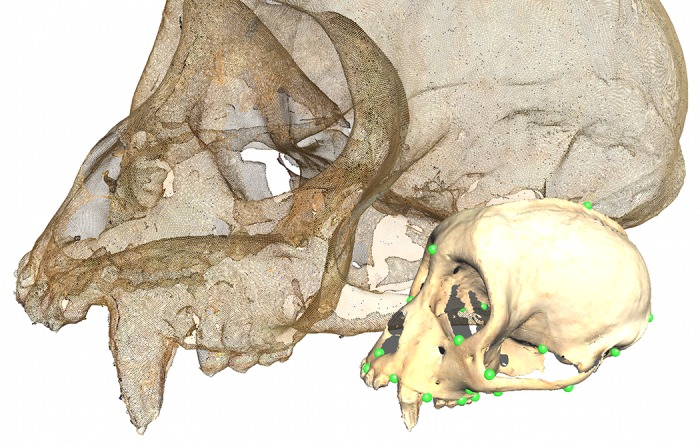
Fig 1. Landmark and surface point distributions for a single specimen.

Foreground: A single specimen with the landmarks highlighted. Background: The same specimen rendered only as the points making up the surface. Note the relatively high density of points in the surface scan and the uneven distribution of landmarks.
