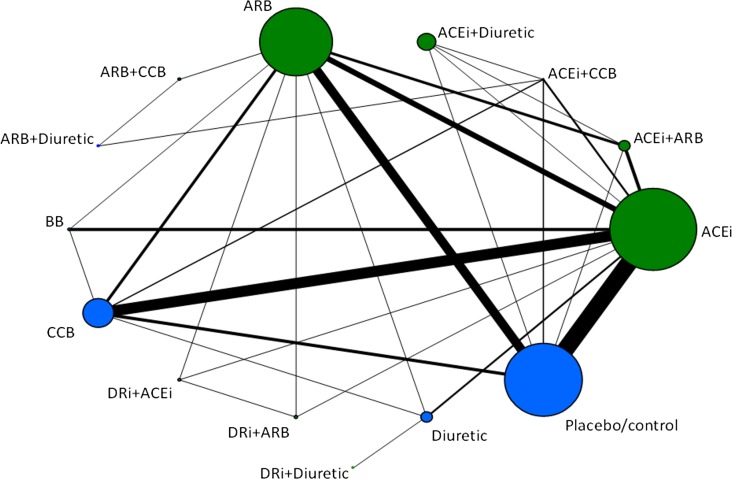
Fig 1. Evidence network of all treatment comparisons for all studies.
Lines represent direct comparisons within randomized controlled trials. The size of nodes is proportional to the number of randomized participants (sample size), and the width of the lines is proportional to the number of trials comparing each pair of treatments. Nodes in green represent RAS blockers (in monotherapy and/or combination therapies). Nodes in blue represent other control arms included in the evidence networks to preserve randomization. ACEi, ACE inhibitor; DRi, DR inhibitor.

