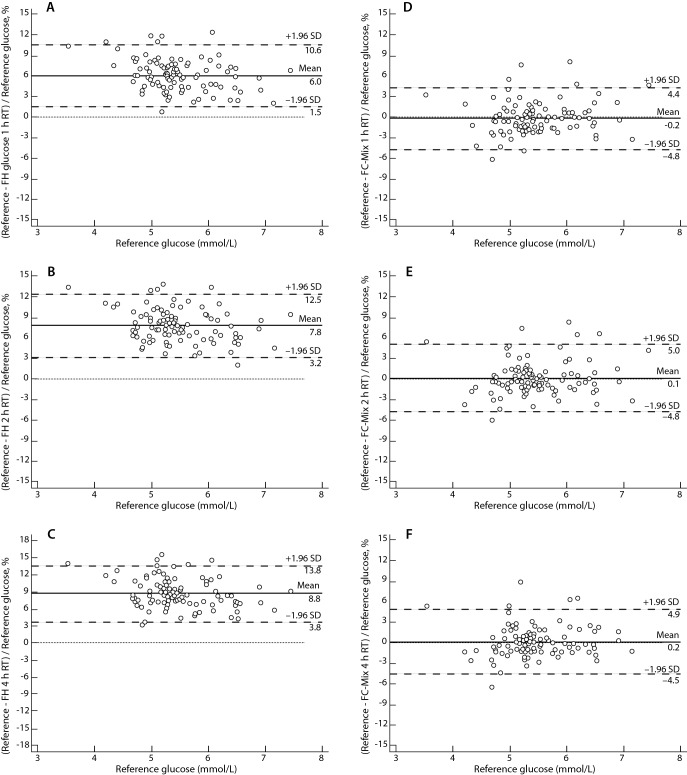
Figure 1.
Comparison of glucose concentrations in sample tubes evaluated, stored at room temperature, with reference glucose concentrations using Bland-Altman plots. Reference glucose concentrations were obtained from lithium-heparin tubes placed in ice-water slurry and centrifuged within 30 minutes, according to ADA-NACB guidelines. A – Comparison of reference glucose with sodium fluoride-sodium heparin (FH) glucose stored for 1 hour. B - Comparison of reference glucose with FH glucose stored for 2 hours. C - Comparison of reference glucose with FH glucose stored for 4 hours. D - Comparison of reference glucose with sodium fluoride-citrate buffer-sodium EDTA (FC-Mixture) glucose stored for 1 hour. E - Comparison of reference glucose with FC-Mixture glucose stored for 2 hours. F - Comparison of reference glucose with FC-Mixture glucose stored for 4 hours. Solid line (mean) – mean difference. Dashed lines (SD) – standard deviation. Dotted line – line of equality.

