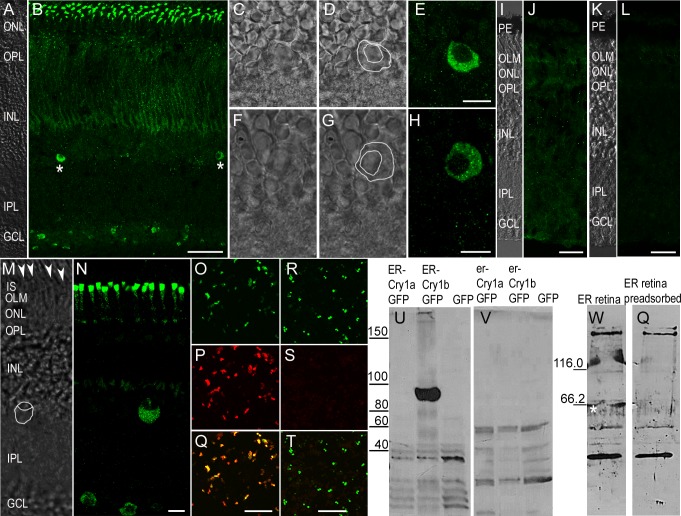
Fig 3. Antibodies against erCry1b confirm Cry1b expression of ganglion cells and inner segments in European robin and Northern wheatear.
Immunolabelling of the erCry1b antibody in the retina of a European robin (A) revealed Cry1b expression (B) in several ganglion cells, in the photoreceptor inner segments and in few cells in the INL (B asterisks). Immunoreactive cells in the very proximal INL (C-H) were significantly bigger than surrounding bipolar cells (C, D, F, G) and showed a large cytosolic space. Immunoreactivity pattern shown in B was absent in controls with the erCry1b antibody blocked by erCry1b peptides (J) and in controls using pre-immune serum (L). In the retina of the Northern wheatear (M, N), the erCry1b antibody showed the same pattern as seen in European robins (N). Staining beneath the photoreceptor oil droplets (M arrowheads) and distal to the OLM indicated Cry1b expression in photoreceptor inner segments (M). Immunocytochemistry of N2a cells expressing erCry1b-GFP fusion protein (O green) showed that the erCry1b antibody (P red) detects erCry1b protein (Q yellow in the overlay). Immunolabelling of erCry1a-GFP expressing cells (R green) indicated that the same antibody did not detect Cry1a protein (S, T). In Western blots, the erCry1b antibody detected a band of the expected size of ~92 kDa in protein homogenates of erCry1b-GFP expressing N2a cells (U middle lane). No band at the appropriate molecular mass was seen in homogenates of erCry1a-GFP (U left lane) or GFP expressing cells (U right lane). The signal at the appropriate molecular mass was absent in negative controls after probing the blot with pre-immune serum (V). Western blots on protein homogenates from retinae of European robins incubated with the erCry1b antibody showed a band of the appropriate size ~64 kDa (W asterisk). This band was absent in controls when the blot was incubated with the pre-adsorbed antibody (Q). Molecular mass marker proteins are indicated on the left (kDa). All confocal images are maximum projections (B, J, L 12.8 μm; N, 3 μm). Images A-L were taken with identical settings. PE, pigment epithelium; IS, photoreceptor inner segments; OLM, outer limiting membrane; ONL outer nuclear layer; OPL, outer plexiform layer; INL, inner nuclear layer; IPL, inner plexiform layer; GCL, ganglion cell layer. Scale bars: A, B 50 μm; D-H, M, N 10 μm; I-L, O-T 25 μm.

