
Fig 1. Downregulation of miR-130b-3p in IPF.
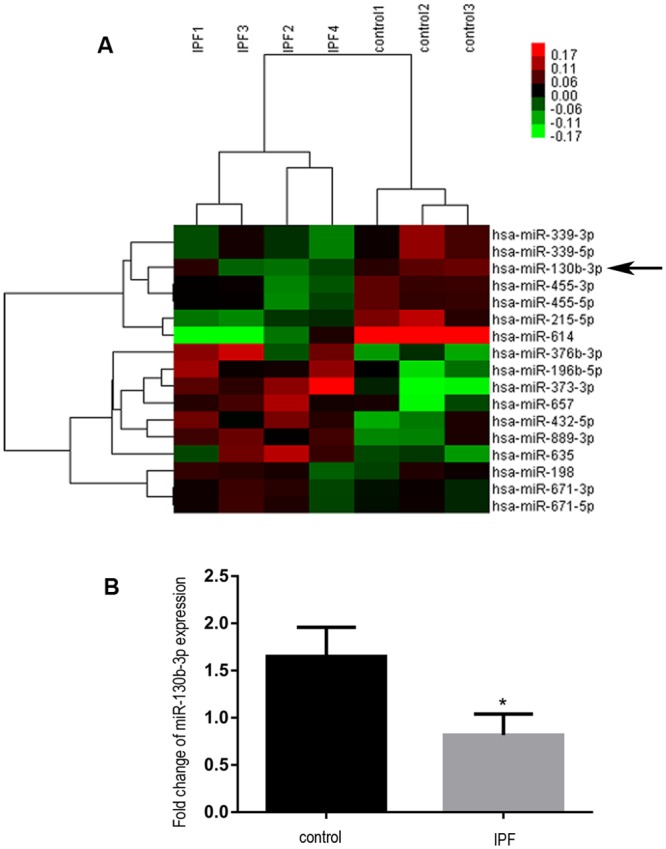
(A) An unsupervised, hierarchical cluster heat map showed 17 differently expressed miRNAs between 4 IPF lungs and 3 normal lungs. Rows represent statistically significant (P<0.05) differentially expressed miRNAs, and columns represent patients and controls. Down-regulated miRNAs are shown in progressively brighter shades of green, depending on the fold difference. Up-regulated miRNAs are shown in progressively brighter shades of red. The names of dysregulated miRNAs are provided in the right of the heat map. An arrow is to denote miR-130b-3p. (B) Quantitative real-time polymerase chain reaction (qRT-PCR) confirmation of the microarray results demonstrated significant change of miR-130b-3p in lung tissues. *P<0.05.