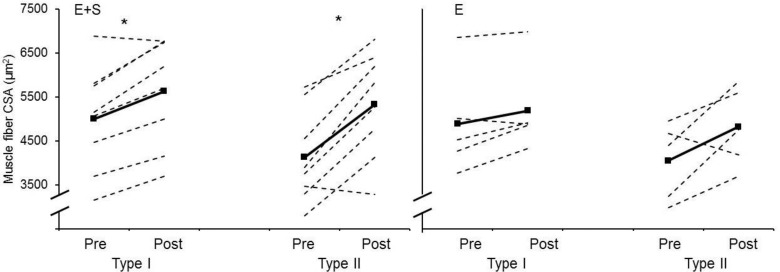
Fig 2. Muscle fiber cross sectional area.
Individual values (dotted lines) and mean values (solid lines) before (Pre) and after (Post) the intervention period for athletes adding strength training to their normal endurance training (E+S, left panel) and athletes performing normal endurance training only (E, right panel). Muscle fiber cross sectional area (CSA) for both type I muscle fibers and type II muscle fibers * Different from pre (p ˂ 0.05)

