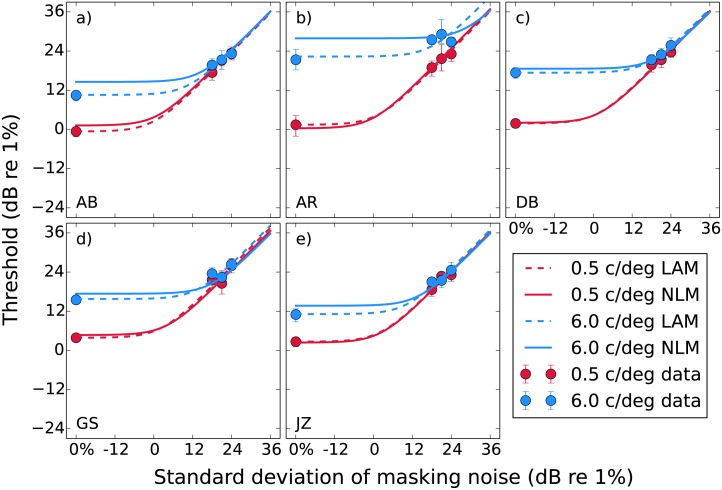
Fig 6. Noise masking functions for our five observers.
Median thresholds obtained from bootstrapping are plotted against the standard deviation of the masking noise, with error bars indicating the 95% confidence intervals. The curves show predictions from the LAM and NLM fitted to the median thresholds. The parameters for these fits are provided in Tables 3 and 4.

