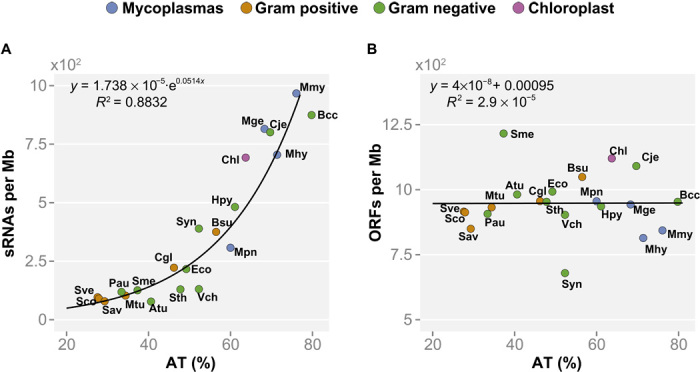
Fig. 1. Different genomic features show distinct dependency on the genomic AT content.

The number of features was divided by the genome size for normalization and represented versus the genomic AT content. The following genomes are represented: Atu, Agrobacterium tumefaciens; Bcc, Buchnera aphidicola (str Cc); Bsu, Bacillus subtilis; Cgl, Corynebacterium glutamicum; Chl, chloroplast (Arabidopsis thaliana); Cje, Campylobacter jejuni; Eco, Escherichia coli; Hpy, Helicobacter pylori; Mge, Mycoplasma genitalium; Mhy, Mycoplasma hyopneumoniae; Mmy, Mycoplasma mycoides; Mpn, Mycoplasma pneumoniae; Mtu, Mycobacterium tuberculosis; Pau, Pseudomonas aeruginosa; Sav, Streptomyces avermitilis; Sco, Streptomyces coelicolor; Sme, Sinorhizobium meliloti; Sth, Salmonella typhimurium; Sve, Streptomyces venezuelae; Syn, Synechocystis spp., Vch, Vibrio cholerae. (A) Number of total sRNAs in different bacteria. Total sRNAs have an exponential dependency on the AT content (R2 = 0.88) and do not correlate with genome size. (B) Genome compaction (that is, number of ORFs normalized by genome size) versus AT content. Genome compaction in the different bacterial genomes analyzed shows no dependency on the AT content. Instead, the number of ORFs in bacterial genomes correlates with the genome size (R = 0.99).
