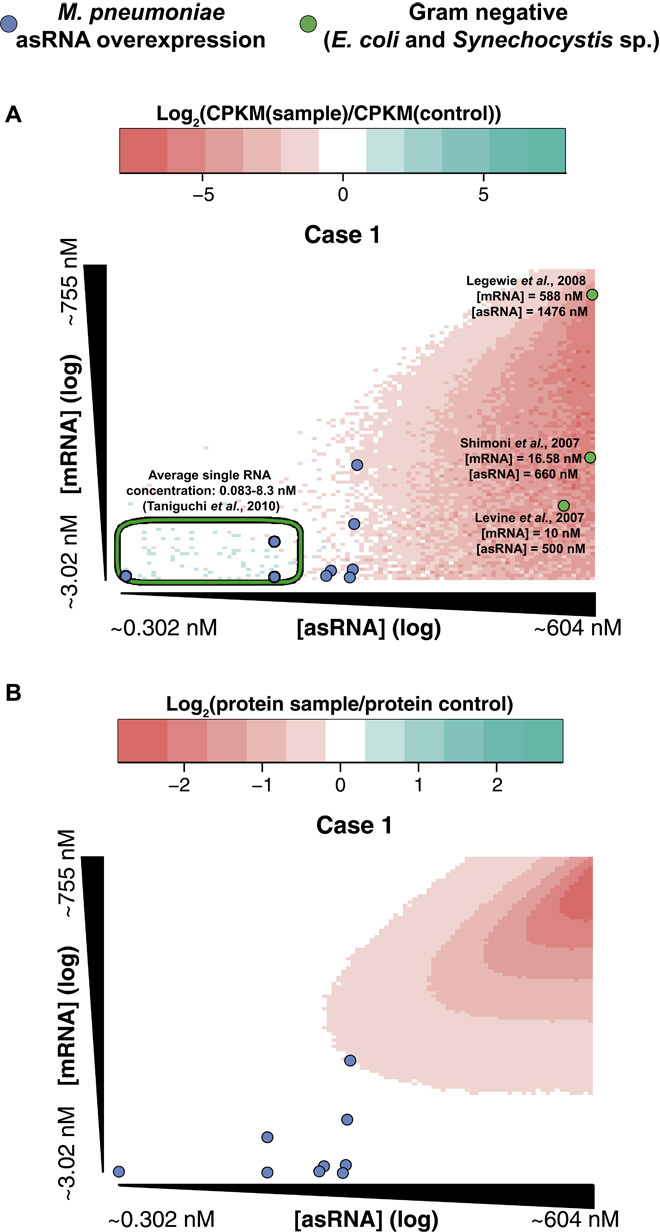
Fig. 2. Simulation of the effect of the asRNAs, assuming that the asRNA-mRNA pairing causes duplex degradation.

Parameters for the simulations are detailed in the Supplementary Materials. Each point of the heat maps represents the average change in the protein concentration for 100 simulations of 1000 min each, for specific parameters of asRNA and mRNA transcription rates. The remaining parameters remain constant for all the simulations. The axes represent the mRNA and asRNA concentration in the control experiments for the corresponding transcription rates scanned. (A) Changes in the mRNA concentration after 1000 min of simulation. Blue circles represent experimental data from the overexpression of asRNAs in M. pneumoniae, whereas green circles represent data from studies in Gram-negative bacteria (29–31). The green ellipse delimits the region of the concentrations of most transcripts in E. coli (28). (B) Changes in the protein concentration after 1000 min of simulation. Blue circles represent experimental data from the overexpression of asRNAs in M. pneumoniae.
