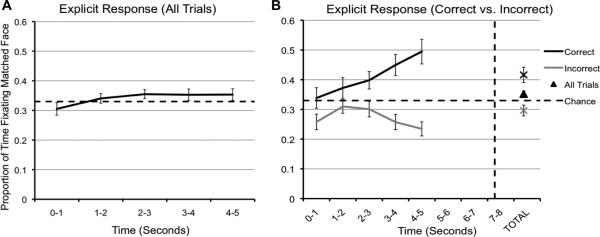
Figure 2.
(a) Data from the explicit response trials. Proportion of time in seconds spent fixating the correct face across all probe trials. (b) The proportion of time spent fixating the correct face as a function of correct vs. incorrect response. The horizontal dashed line represents chance performance (33%), the vertical dotted line represents the average response time.

