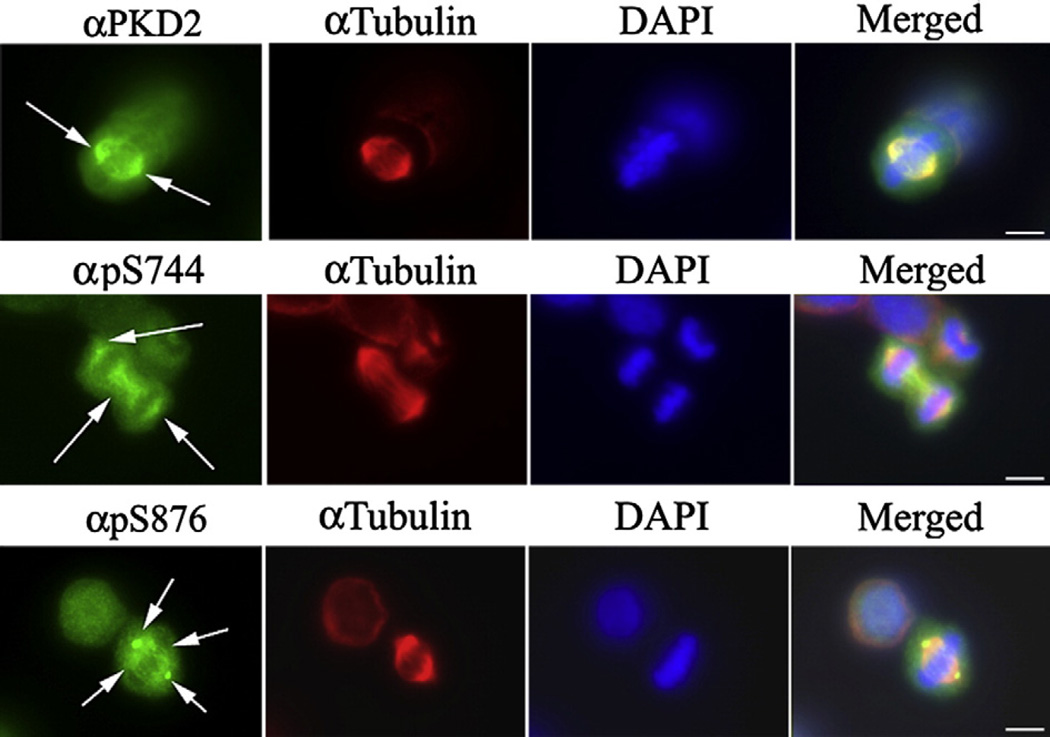
Fig. 7.
Intracellular distribution of activated PKD2 during mitosis. Unsynchronized NCM-460 cells were processed for indirect immunofluorescence and examined with an epifluorescence microscope as described under Materials and methods. Samples were stained with an antibody that recognizes PKD2 (top panels), with the phospho-specific antibody pS744 (middle panels) which recognizes phosphorylated Ser706 within the activation loop of PKD2, or with the phospho-specific antibody pS876 that recognizes PKD2 phosphorylated at Ser876 (bottom panels), a PKD2 autophosphorylation site. Alexa 488-conjugated chicken anti-rabbit IgG was used as secondary antibody. α-tubulin was detected using a murine monoclonal antibody and secondary Alexa 568-conjugated goat anti-mouse IgG. DNA was counterstained using 0.0005% DAPI. Bar: 10 µm.

