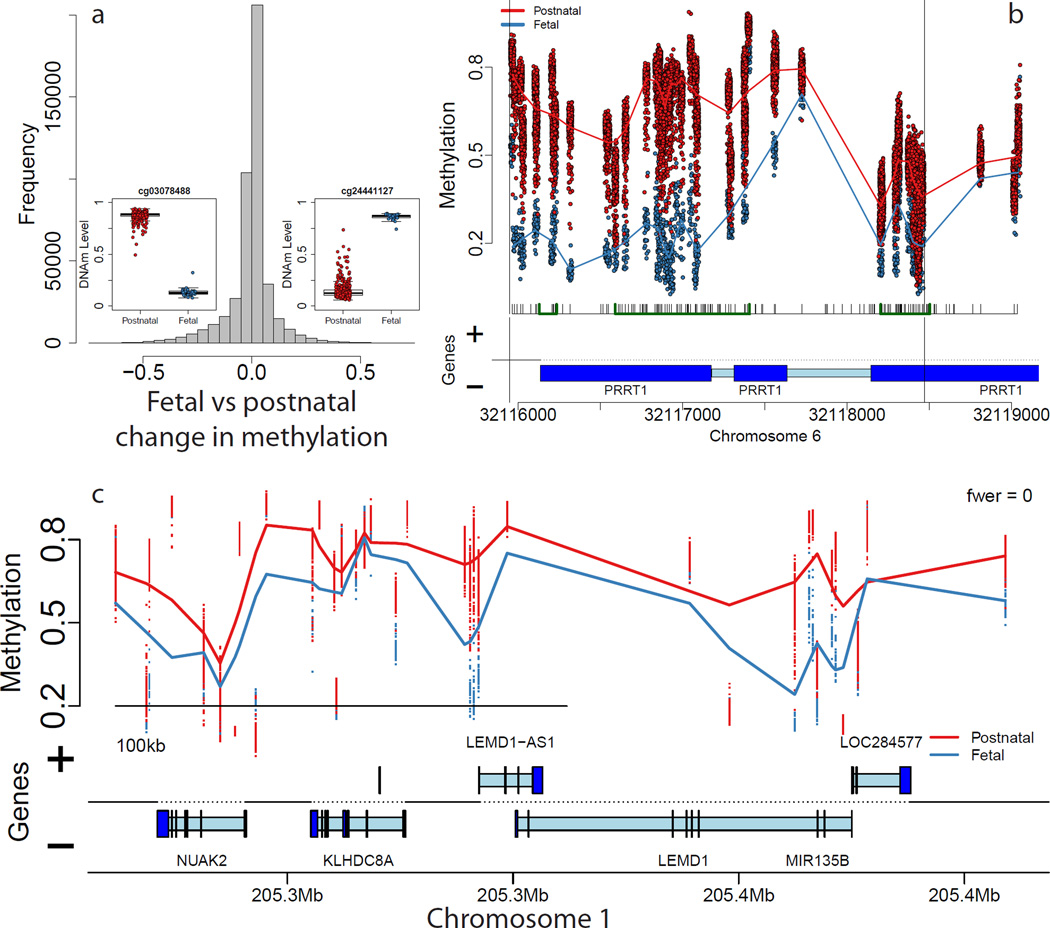
Figure 1.
Differentially methylated loci comparing pre- and post-natal control subjects show large differences in DNA methylation. (A) Distribution of differences in DNAm across all individual CpGs/probes shows many sites with large changes in DNAm. Insets: examples of differentially methylated loci. (B) An example differentially methylated regions (DMRs) representing regional differences in DNAm levels. (C) An example methylation block representing long range changes. Proportion methylation is shown on the y-axis of the insets in panels B,C and the insets in panel A. Gene annotation panels in (B) and (C) are based on Ensembl annotation – dark blue represents exons and light blue represents introns.

