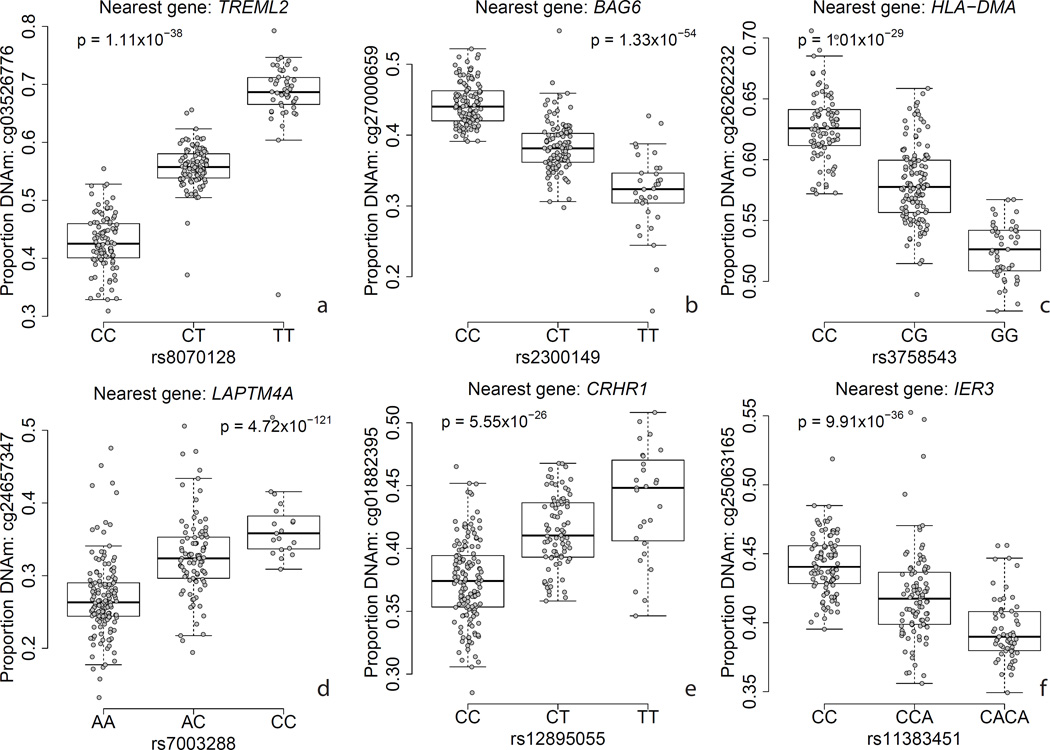
Figure 3.
Examples of methylation quantitative trait loci (meQTLs) for six GWAS-associated variants with nearby DNA methylation levels. Y-axis: DNA methylation level at a particular probe, X-axis: genotype at a particular SNP, p-value corresponds to the effect of genotype on DNAm level, adjusting for ancestry and epigenetic principal components.

