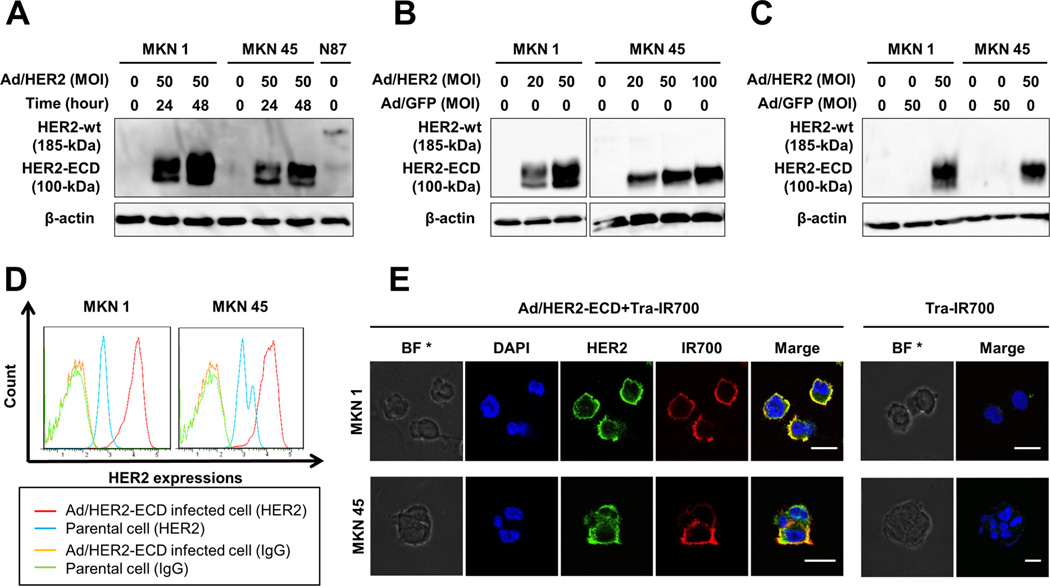
Figure 1.
HER2-ECD expression induced by Ad/HER2-ECD and the distribution of Tra-IR700 in gastric cancer cells. A, Western blot analysis revealed that MKN1 and MKN45 did not express wild-type (wt) HER2 (185 kDa), whereas N87 cells expressed it. Infection with Ad/HER2-ECD at a multiplicity of infection (MOI) of 50 for 24 and 48 h induced the expression of the 100 kDa HER2-ECD protein in MKN1 and MKN45 cells. β-actin was used as a loading control. B, MKN1 and MKN45 cells were infected with Ad/HER2-ECD at a different MOI for 48 h. Western blot analysis showed that the HER2-ECD protein levels were increased depending on the MOI of Ad/HER2-ECD. C, Ad/HER2-ECD induced HER2-ECD protein to be specifically expressed in gastric cancer cells as compared with Ad/GFP as a control adenovirus expressing green fluorescent protein. D, flow cytometric analysis showed HER2-ECD expression. Parental or Ad/HER2-ECD-infected cells were stained with APC-conjugated mouse monoclonal anti-HER2-ECD antibody (blue and red) and APC-conjugated mouse monoclonal IgG2b as a negative control (green and orange). The expression levels of HER2-ECD in Ad/HER2-ECD-infected cells were increased as compared to those of parental cells. E, immunocytochemistry of HER2-ECD and Tra-IR700 on gastric cancer cells. Cells were infected with Ad/HER2-ECD at an MOI of 50 for 48 h and then Tra-IR700 was added for 1 h. HER2-ECD expression was identified by APC-conjugated anti-HER2 antibody, and Tra-IR700 was confirmed by IR700 fluorescence signal. The yellow color on the cellular membrane in the merged image indicated the identical distribution of Tra-IR700 and HER2 induced by Ad/HER2-ECD. * Bright field. Scale bar, 20 µm.

