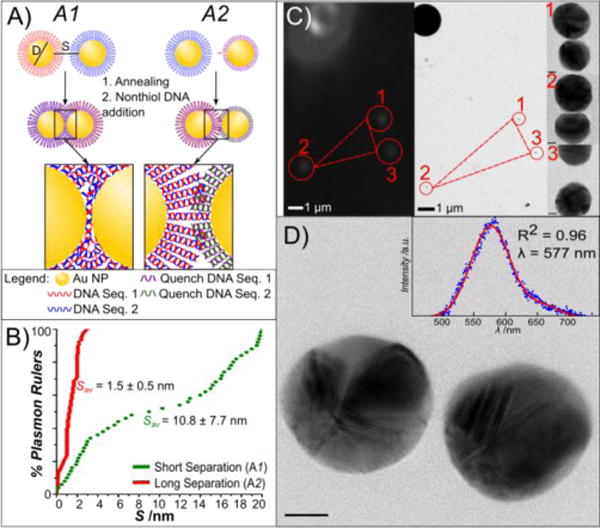
Figure 1.

DNA-programmed self-assembly of PRs and correlated spectral/structural characterization. A) Scheme of PR assembly strategies. Approach A1 uses a high density of hybridizing DNA, whereas synthesis approach A2 uses a 1:1 ratio of handle DNA to NP. B) Cumulative probability distribution plots of the interparticle separation, S, for assembly strategies A1 and A2. Gap separations over 20 nm were not considered as PRs. C) Correlation of darkfield microscopy/spectroscopy (left) and transmission electron microscopy (right). NP patterns (here marked 1–3) in the vicinity of PS marker beads are used to localize PRs characterized by optical spectroscopy in the TEM at low magnification (210x). Images are then recorded at higher resolution (180kx) to obtain structural details of the PRs, shown to the left of the image. D) Correlated TEM image and darkfield spectra (inset) of a PR. Scale bar is 10 nm.
