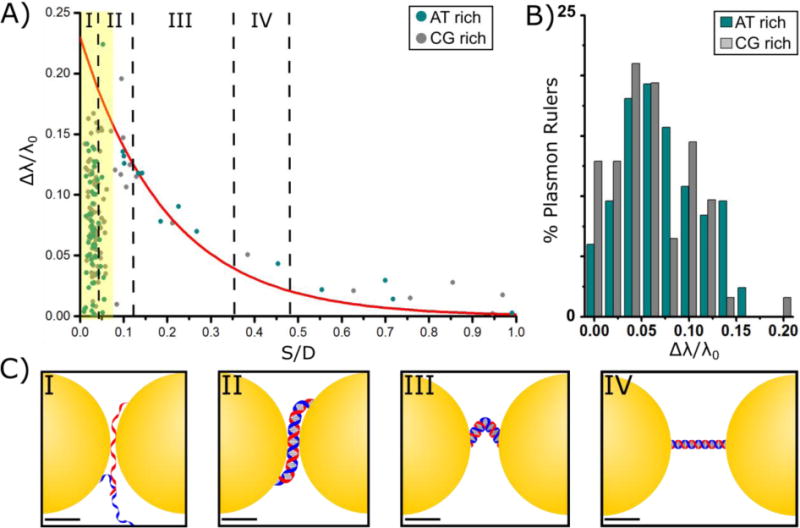
Figure 2.

Distance dependent plasmon coupling in PRs. A) Normalized spectral shift, Δλ/λ0, as function of the ratio of interparticle separation to NP diameter, S/D. Blue circles belong to PRs containing CG enriched DNA, black black circles correspond to PRs with AT enriched DNA. The continuous red line represents the universal scaling law prediction. The yellow area highlights S/D ≤ 0.07 (S ≤ 2.8 nm) where the experimental spectra deviate from the classical electromagnetic prediction. B) Histogram of Δλ/λ0 for PRs containing CG enriched (blue) or AT enriched (gray) DNA. C) Possible DNA configurations at varying lengths. At longer separations than IV the DNA is ruptured and does no longer span the gap between the NPs. Scale bars are 10 nm.
