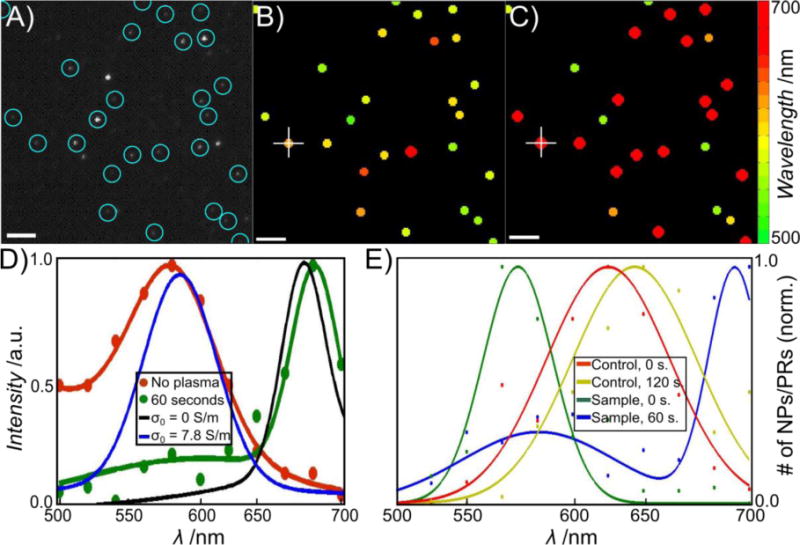
Figure 3.

DNA removal through plasma cleaning red-shifts the plasmon resonance of PRs with short interparticle separation (average interparticle separation: S = 1.5 ± 0.5 nm). A) Monochromatic darkfield image of arbitrarily chosen field of view. PRs present before and after plasma cleaning are encircled. B) Peak wavelengths of the individual PRs before plasma cleaning as determined by hyperspectral imaging (see text). The peak wavelength is encoded in the color as given by the color map. C) Peak wavelengths of the same PRs after 60 seconds of plasma cleaning. D) Sample spectra obtained from hyperspectral imaging before (red) and after (green) plasma cleaning for the PR marked with white + in B and C. Simulated spectra of PRs before (σ0 = 7.8 S/m) and after (σ0 = 0) plasma cleaning are included in blue and black, respectively. E) Distribution of the fitted resonance wavelength of > 300 PRs with short interparticle separation before (green) and after (blue) plasma cleaning. The spectra after plasma cleaning are significantly red-shifted. Distributions for PRs with 80 bps spacer before (red) and after (yellow) plasma cleaning are included as larger interparticle separation control.
