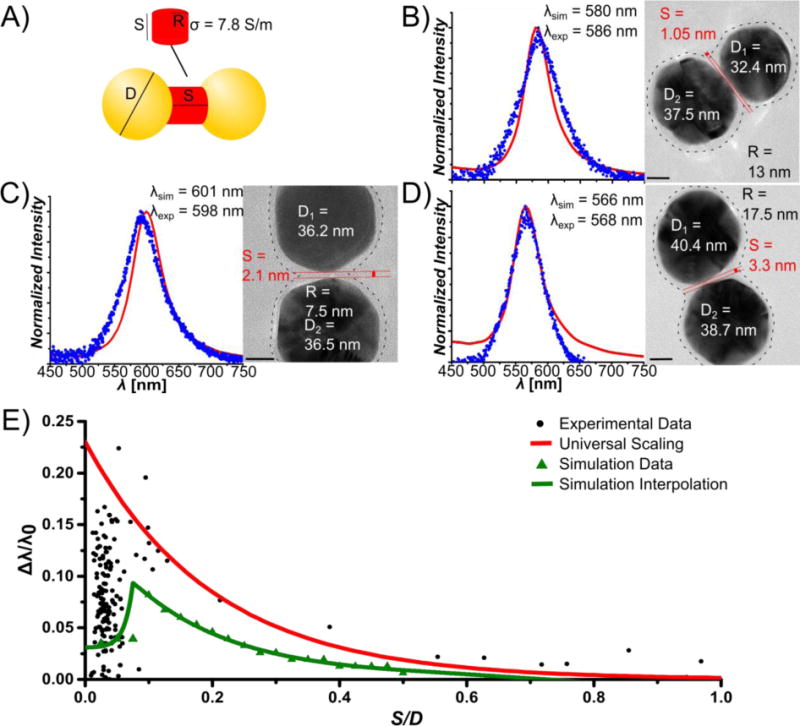
Figure 4.

FDTD Simulations of Plasmon Rulers. A) Structural parameters for quantum corrected model containing a conductive junction to mimic tunneling through a DNA linker. B–D) Comparison of the simulated and experimental spectra for three selected PRs with minimum interpartice separations of S = 1.05 nm (B), S = 2.1 nm (C), S = 3.3 nm (D). The fitted experimental and simulated peak resonance wavelengths λexp and λsim are noted. TEM images for the individual PRs, together with the geometric parameters S, R, D are included. The circumference of the DNA corona around the NPs is indicated as dashed line. R was determined from the separation of the dotted lines in the center of the interparticle gap. E) Simulated Δλ/λ0 vs. S/D plot (green triangles) assuming a quantum corrected model with a gap conductivity of σ0 = 7.8 S/m for S < 3 nm and σ0 = 0 for S > 3 nm (R = 10 nm). The universal scaling prediction (red line) and experimental data (black circles) are included for completeness.
