
FIG. 11.
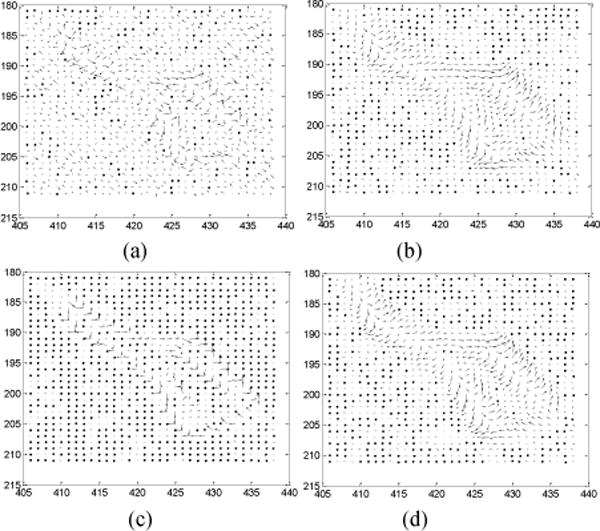
NVF images of a ROI labeled in Fig. 9(a). The NVF images in Fig. 11(a)–(d) are corresponding to the reconstructions in Fig. 9(a)–(d).
Official websites use .gov
A
.gov website belongs to an official
government organization in the United States.
Secure .gov websites use HTTPS
A lock (
) or https:// means you've safely
connected to the .gov website. Share sensitive
information only on official, secure websites.
NVF images of a ROI labeled in Fig. 9(a). The NVF images in Fig. 11(a)–(d) are corresponding to the reconstructions in Fig. 9(a)–(d).