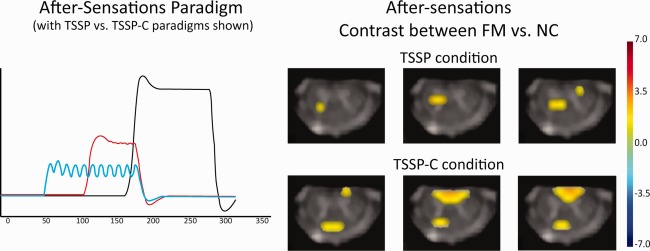
Figure 7.

Key areas with significantly different responses to the after‐sensations between FM and NC are shown to be the right dorsal horn region of the C6 segment in both the TSSP and TSSP‐C conditions. On the left is an illustration of the after‐sensation paradigms convolved with the hemodynamic response function as used in the GLM analysis (red = TSSP paradigm, blue = TSSP‐C). [Color figure can be viewed in the online issue, which is available at http://wileyonlinelibrary.com.]
