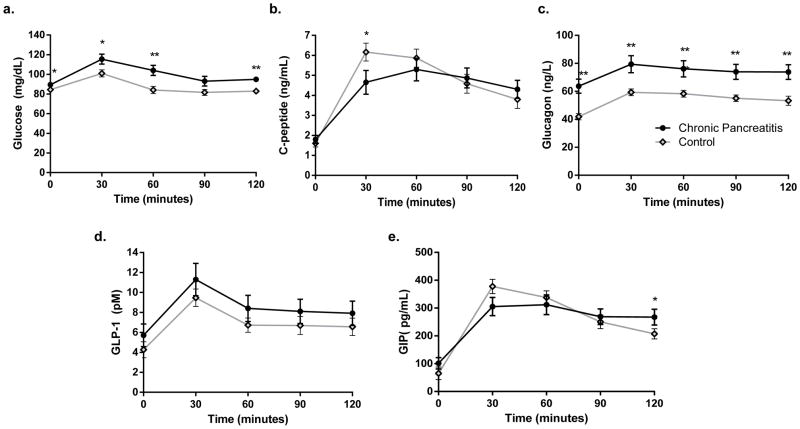
Figure 1.
From mixed meal tolerance tests in chronic pancreatitis (dark circle) and healthy control (grey diamonds): (a) glucose; (b) C-peptide; (c) glucagon levels, (d) GLP-1, and (e) GIP. AUC glucose and AUC glucagon were significantly higher in the CP cohort, but AUC C-peptide, GLP-1, and GIP did not differ between groups. * indicates p-value ≤0.05, ** p ≤0.01.

