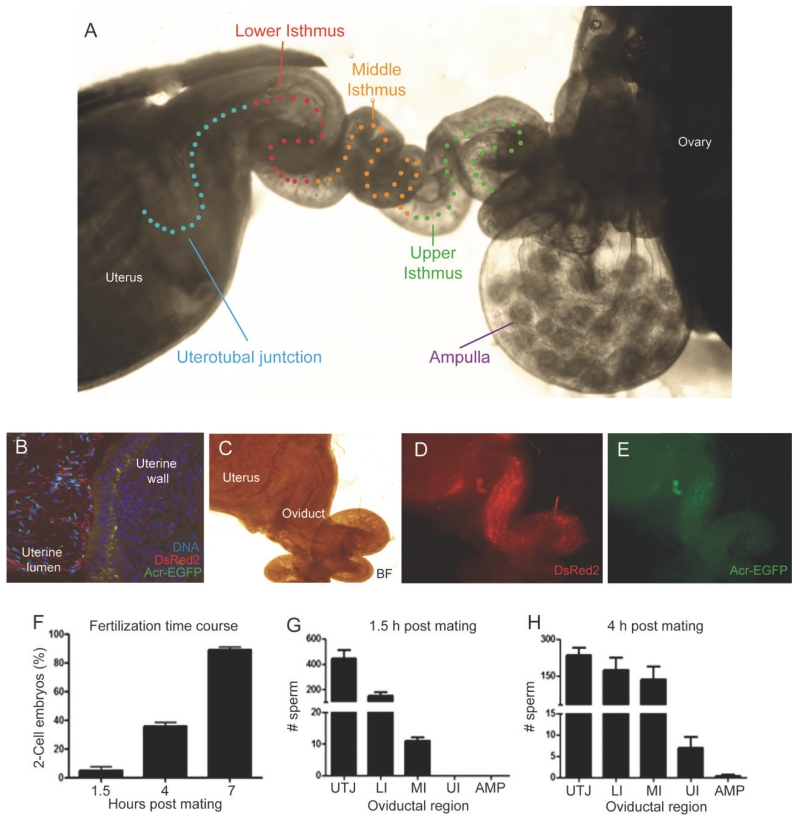
Figure 2.
Evaluation of the timing of in vivo fertilization in mouse. A) Representative diagram showing the different parts of the oviduct that were evaluated in this study; B) Representative image of a cross section of the uterus. Sperm were deposited in the uterus after natural mating. C, D and E) Transgenic sperm in the uterus and the oviduct after mating. The bright field image is shown in C. The DsRed2 (D) and the EGFP (E) fluorescence is visible through the uterus and oviductal walls. Most of the sperm are located in the uterus while very few cross the UTJ and locate in the lower isthmus. F) Time course of in vivo fertilization. The ovulated eggs were removed from the ampulla after 1.5, 4 or 7 h post mating and incubated in culture medium for 24 h. Then, the percentage of two-cell embryos was recorded. G) Number of sperm quantified using z-stacks images of confocal microscopy in each segment of the oviduct after 1.5 h post mating. H) Number of sperm quantified using z-stacks images of confocal microscopy in each segment of the oviduct after 4 h post mating. Data represent the mean ± standard error of the mean (SEM; n = 5 experiments).

