Figure 3.
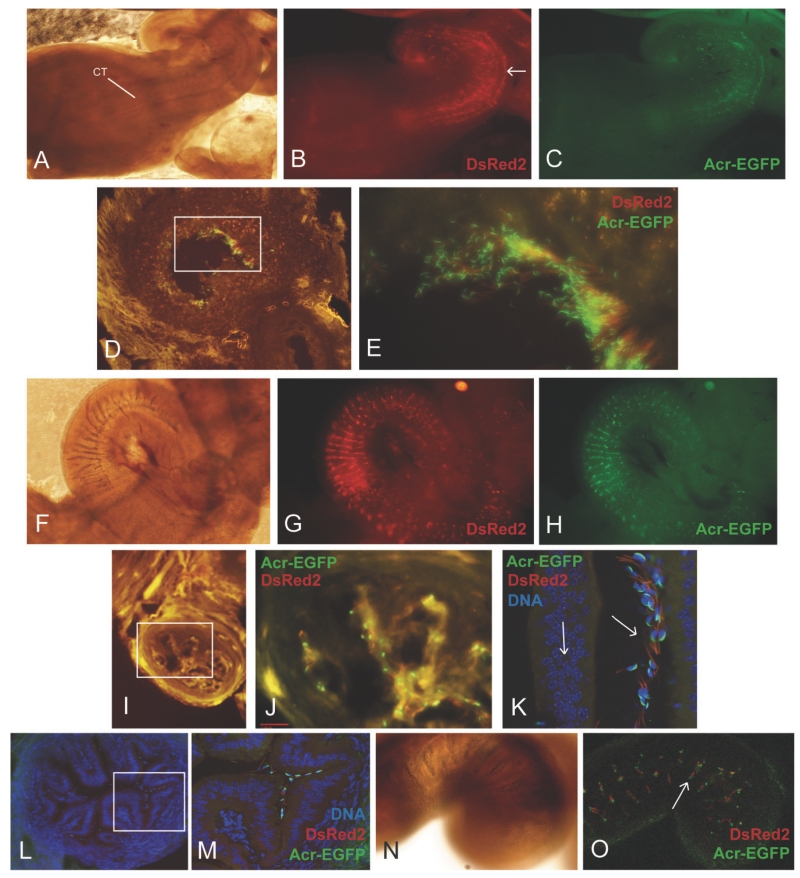
Sperm migration through the UTJ and Isthmus. A) Bright field image of the uterus, UTJ and lower segment of the isthmus. The arrow indicates the colliculus tubarius (CT) protruding into the uterine lumen. B) DsRed2 fluorescence of the image shown in A. Sperm tend to migrate through the UTJ in the pockets between mucosal folds. The arrow in B indicates the mucosal fold were most of the sperm are located. C) EGFP fluorescence of the image shown in A. Most of the sperm in this region have substantially intact acrosomes. D) Cross section of the UTJ after 1.5 h post mating E). Higher magnification of the area depicted in D. Most of the sperm in this region are acrosome intact. F) Bright field representative image the lower isthmus. G and H) DsRed2 and EGFP fluorescence images of 3A respectively. I) Bright field image of a frozen section of the lower isthmus. Sperm were distributed in folds as well as in the central portion of the lumen, in particular, in the region of the lower isthmus that is close to the UTJ. Sperm that locate in the lumen were swimming freely in contrast to the sperm that were located in the folds that were epithelium-bound sperm. J) Higher magnification image of the area depicted in I. K) Representative fluorescent image (merge of DAPI, EGFP and DsRed2) of a cross section of the lower isthmus showing the acrosome intact sperm located in the oviductal folds. The right arrow indicates the oviductal fold. The left arrow indicates the oviductal wall. L) Representative confocal image of a cross section of the middle oviductal isthmus after 4 h post mating. M) Higher magnification image of the area depicted in L. N) Representative bright field image of the middle isthmus. O) Confocal images showing transgenic sperm located in the oviductal folds (arrow).

