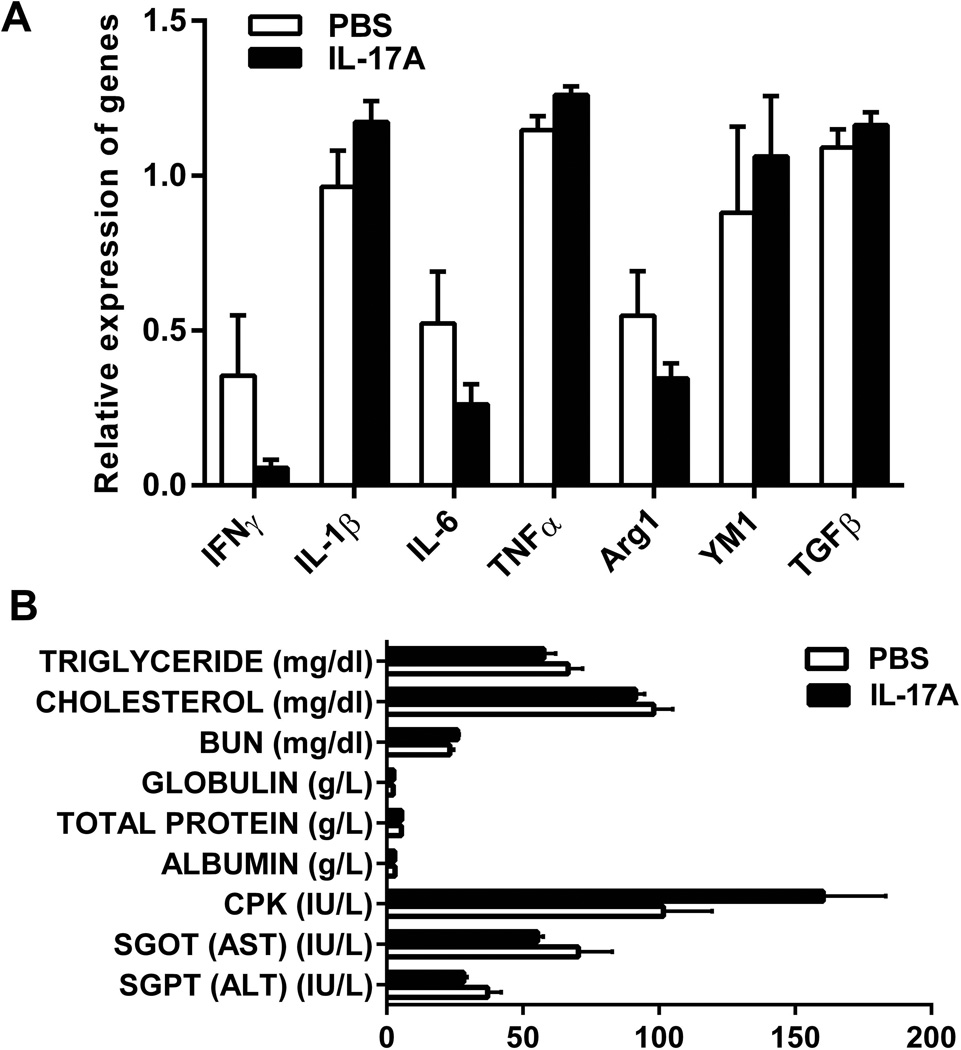
Figure 2. M1 and M2 macrophage/microglia markers and blood chemistry tests.
(A) mRNA expression levels of M1 and M2 macrophage/microglia markers in the brains of IL-17A-in-Brain and PBS-in-Brain mice determined by real-time PCR are shown. The values were normalized to β-actin. No difference was found between the two groups (n=4 for each group). (B) Blood biochemical profiles in IL-17A-in-Brain and PBS-in-Brain mice. All values of the blood chemistry results and plasma creatinine levels (<0.2 mg/dl, not shown) are within normal ranges and show no differences between the two groups (n=4 for each group).

