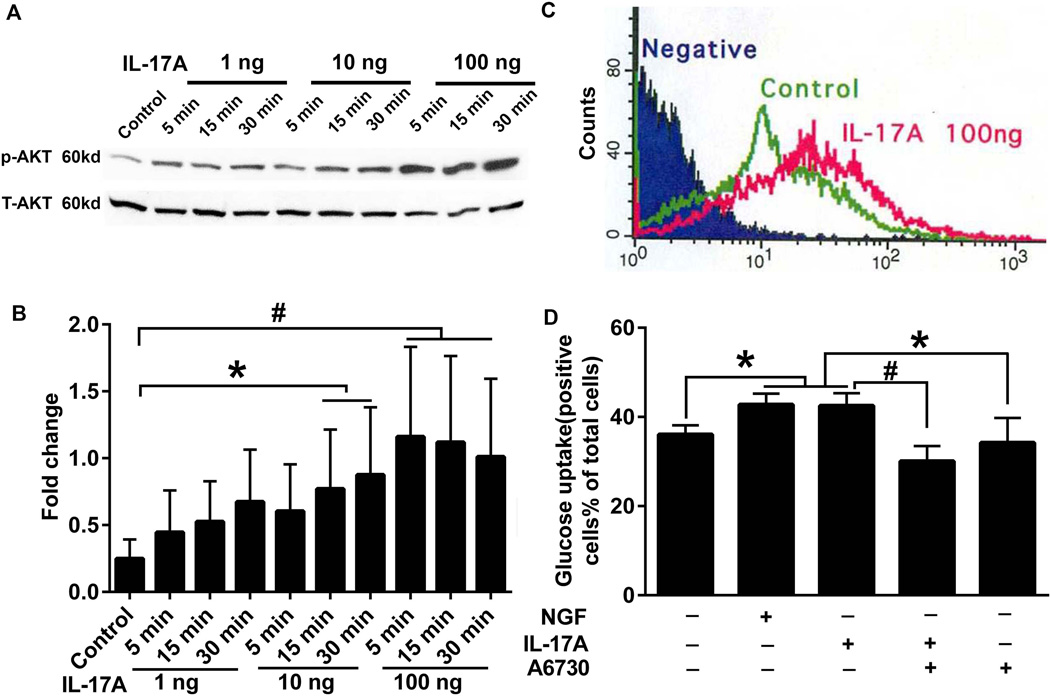
Figure 8. Effect of IL-17A on activation of Akt and glucose uptake.
(A) PC12 cells were treated with 1, 10 and 100 ng/ml IL-17A for 5, 15 and 30 min. The cell lysates were analyzed by western blotting using phospho-Akt (S473, p-Akt) and total-Akt (T-Akt) antibodies. (B) The bar graph represents the results of densitometric analysis of western blots shown in A. (C) PC12 cells were treated with or without IL-17A 100 ng/ml for 30 min followed by treatment with 2-NBDG for 10 min. Glucose uptake curves by flow cytometer are shown. Negative and Control stand for PC12 cells prepared without 2-NBDG and IL-17A treatment, respectively. Glucose uptake curve of PC12 cells treated with NGF is identical to that of IL-17A-treated PC12 cells (not shown). (D) PC12 cells were pretreated with or without Akt 1/2 inhibitor, A6730, for 30 min followed by treatment with or without 100 ng/ml IL-17A. NGF (100 ng/ml) treatment serves as a positive control. Bar graphs present percentages of PC12 cells that show glucose uptake by flow cytometer (D). The statistical results, * P<0.05 and # P<0.01, are from three independent experiments as shown in B and D.

