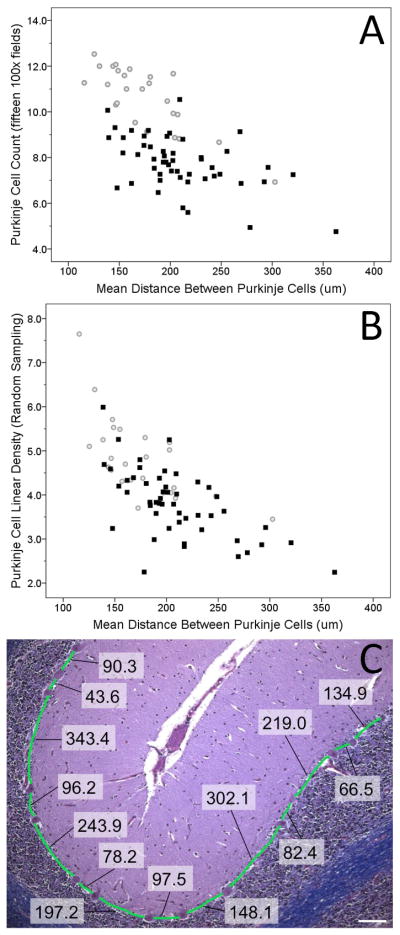
Figure 1.
Reduced Mean Purkinje Cell Counts quantified in fifteen100x fields (A) or by randomly-sampled Purkinje cell linear density (B) in 50 Essential Tremor Cases (black squares) versus 25 Age-Matched Controls (gray circles) and Correlation with Mean Nearest Neighbor Distance. (C) Purkinje cell nearest neighbor quantification in LH&E- stained cerebellum cortical section. The nearest neighbor measurements between Purkinje cell bodies in a control are displayed and measured based on the Purkinje cell layer shown in green (100x magnification). All measurements were taken in micrometers (μm), scale bar in white is 100 μm.

