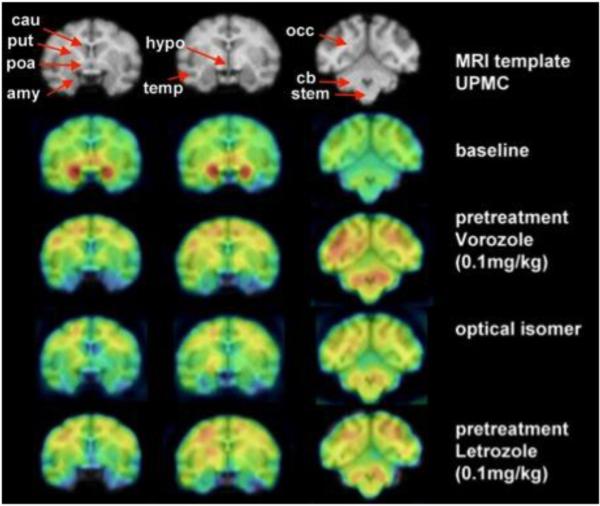
Figure 4. Regional Distribution and specificity of [11C]vorozole uptake in the female baboon brain.
The upper row shows the magnetic resonance imaging (MRI) coronal sections of the template chosen. Regions of interest (ROI) are indicated with an arrow. The second row shows a baseline positron emission tomographic study (summed frames minutes 20–90) overlayed on the MRI template. The third row shows a pretreatment study with vorozole (0.1 mg/kg) followed by a study where the inactive optical isomer was labeled and injected. The last row shows the distribution when pretreatment was done with letrozole (0.1 mg/kg). amy = amygdala; cau = caudate; cb = cerebellum; cwm = cortical white matter; occ occipital cortex; poa = preoptic area; put = putamen; stem = brainstem; temp = temporal cortex. Note that pharmacological doses of vorozole and letrozole increase the levels of free tracer in plasma (probably due to competition for binding to blood cells) so the levels in brain are increased as well; but specific binding (represented as ratio of region to plasma, or ratio to cerebellum, or VT) is not increased (Pareto et al; 2013)

