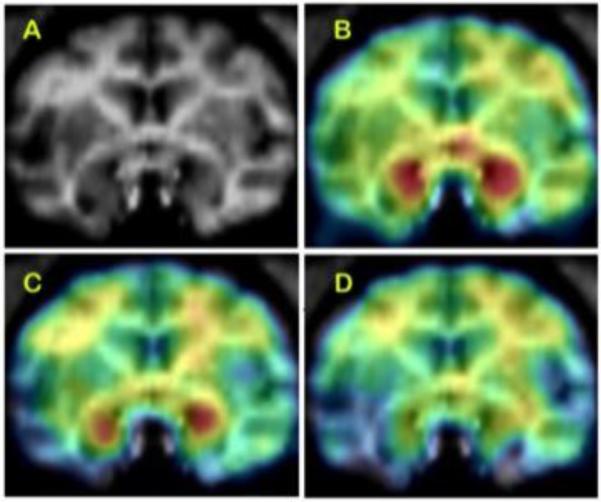
Figure 6. Effect of nicotine on brain aromatase availability in female baboon brain.

Top: (A) baboon brain magnetic resonance imaging (MRI), coronal section at the level of amygdala. (B) Representative baseline positron emission tomography (PET) image coregistered with MRI. (C) The PET image of same baboon after low-dose nicotine (.015 mg/kg), coregistered with MRI. (D) The PET image after injection of high-dose (.03 mg/kg) nicotine, coregistered with MRI. The PET images show dose-corrected averaged frames acquired between 52.5 and 90 min after tracer injection, pseudocolored with the rainbow spectrum, with purple indicating the lowest density and red indicating the highest density of radioactivity.
