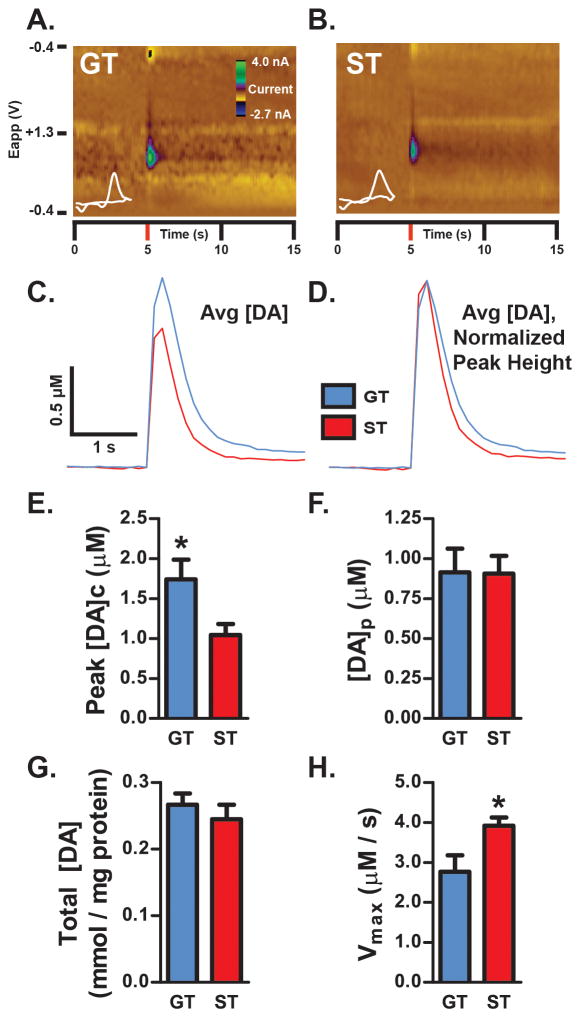
Figure 2. DA signaling.
DA release evoked by electrical stimulation of the NAc core was recorded using ex vivo FSCV. Representative color plots from a single 1-pulse stimulation are shown for a GT (A) and ST (B) rat. Stimulation occurred at 5-s into the recording. Plots show current changes recorded on the electrode, plotted against the applied voltage (Eapp) and time. The holding potential applied to the carbon-fiber electrode (−0.4 V) was ramped to +1.3 V and back to −0.4 V at a rate of 10 Hz. Cyclic voltammograms plotting current versus voltage at the peak DA response are shown in white. (C) Calibrated average [DA] traces for GT (n=5) and ST (n=6) rats following 1-pulse stimulation are shown. (D) In order to better illustrate differences in DA uptake between STs and GTs, the average [DA] traces in (C) were normalized to peak height following stimulation. The resulting [DA] traces show that STs return to baseline faster than GTs. (E) GTs displayed significantly greater peak stimulated [DA]c compared to ST (p<0.05). There were no significant differences in either the amount of DA released per stimulation pulse (F; [DA]p) or in total tissue [DA] measured in ventral striatal synaptosomes using HPLC (G). (H) STs displayed significantly faster DA uptake relative to GTs following electrical stimulation (*p<0.05). Results plotted as mean ± SEM.

