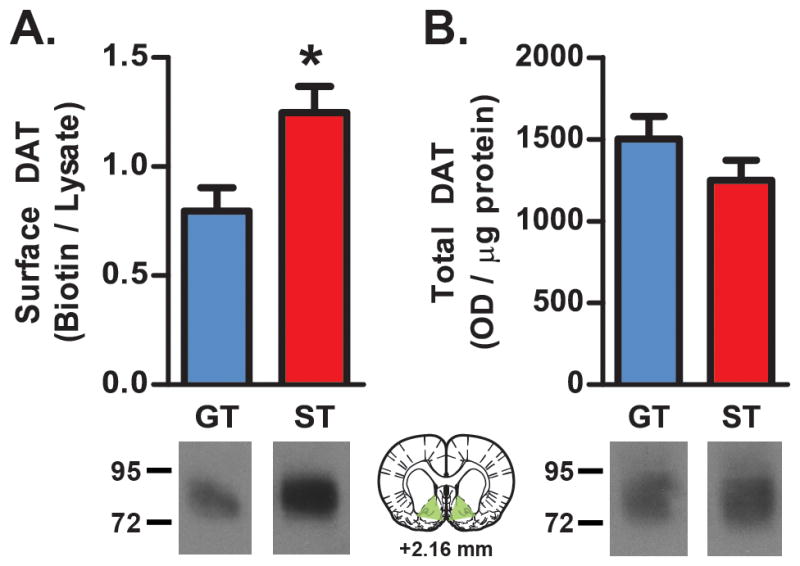
Figure 3. DAT expression.

DAT expression was assessed in ventral striatal synaptosomes (ST, n=10; GT, n=8). (A) STs displayed greater DAT surface expression (biotinylated/lysate) compared to GTs (*p<0.05). (B) There was no difference in total (lysate) DAT expression. Representative western blots showing DAT expression are displayed below graphs. The green-shaded region on the drawing of a coronal brain section (adapted from Paxinos and Watson 2004) shows the region dissected for DAT measurements. Results plotted as mean ± SEM.
