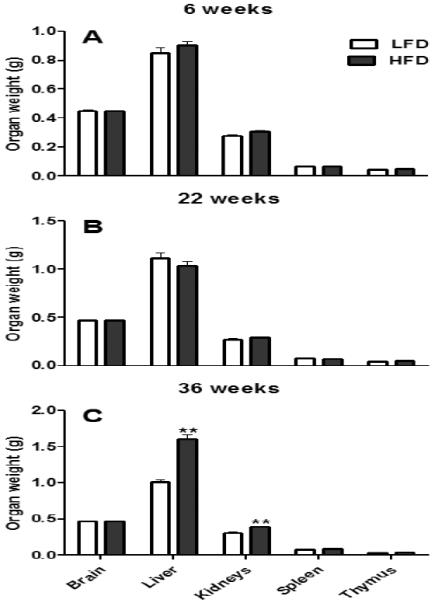
Figure 3.

Absolute (g) organ weights of female C57BL/6 mice fed either a high fat diet (HFD) or a control, low fat diet (LFD) for 6 (A), 22 (B), or 36 (C) weeks. Graphical representations are mean ± SEM (n = 8/group/time point). ** P ≤ 0.01 represent effects within a time point.
