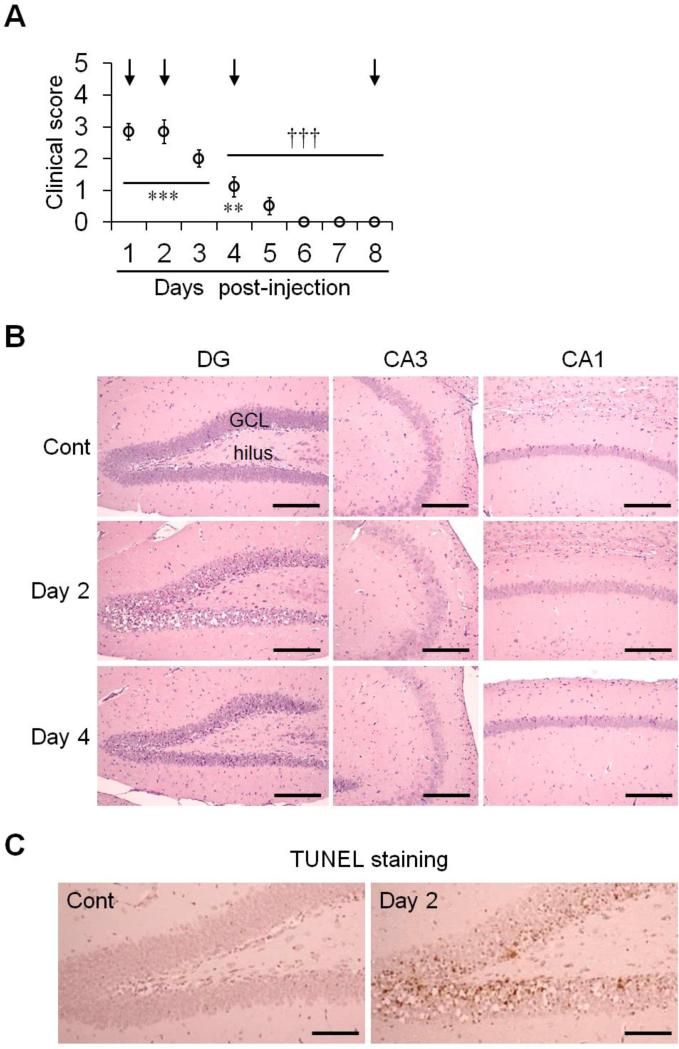
Fig. 1.
Clinical seizure scores and histological findings in the hippocampus of mice treated with TMT. (A) Clinical symptoms were scored (0–5) for 8 days after TMT injection. Mice were sacrificed at the times indicated by the arrows. The data are reported as the means ± SEs (n = 10 per group). ** p < 0.01, *** p < 0.001, vs. vehicle-treated controls; ††† p < 0.001, vs. peak stage of seizure scores (day 2 post-injection). (B) Histopathological analysis was performed using H&E staining at 2 and 4 days post-treatment. (C) Apoptotic neuronal cell death was determined by TUNEL staining in the hippocampus 2 days post-treatment. DG, dentate gyrus; CA, cornu ammonis; GCL, granular cell layer; Cont, controls. Scale bars represent 180 μm (B) and 130 μm (C).

