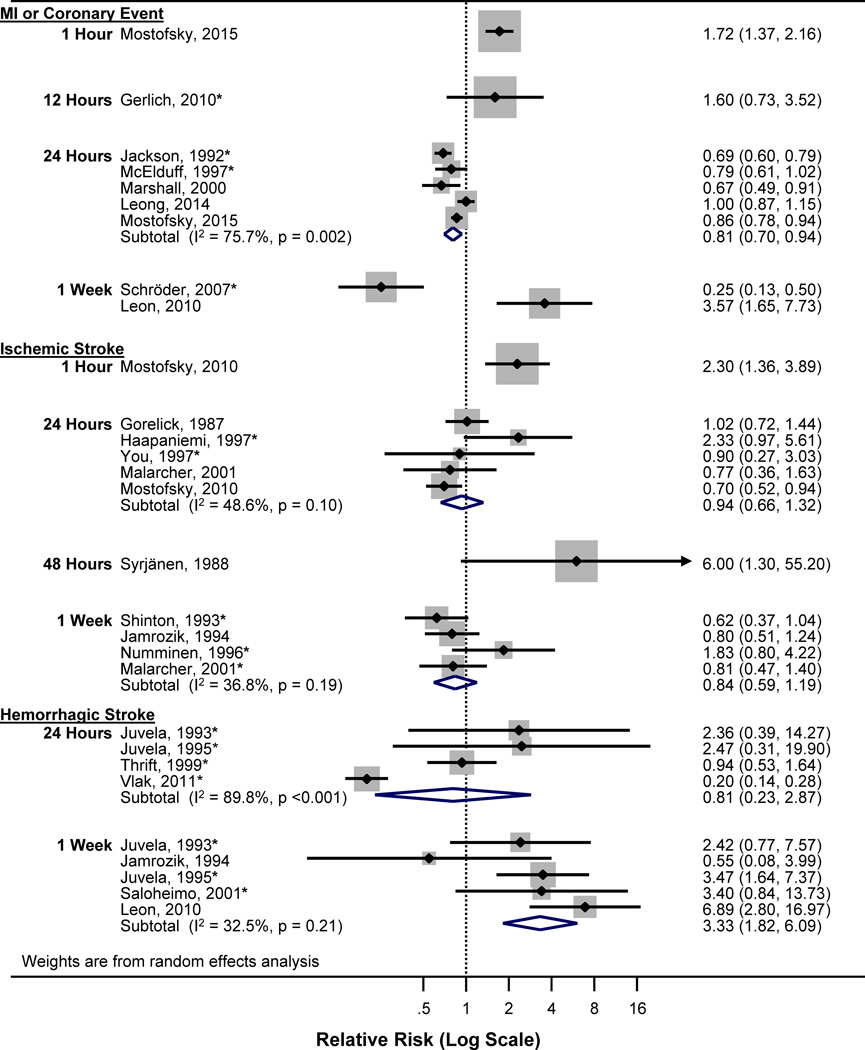
Figure 2.
Forest plot of relative risks (RRs) and 95% confidence intervals (CIs) for the association between any alcohol consumption relative to no drinking. Squares indicate study-specific RR estimates, with the size of the square reflecting the proportion of the DerSimonian and Laird weights under study; horizontal lines indicate the 95% CI; diamonds indicate the pooled RRs with their 95% CI from a random-effects model. The dotted line indicates the value for no association. *Also included in dose-response meta-analysis.

