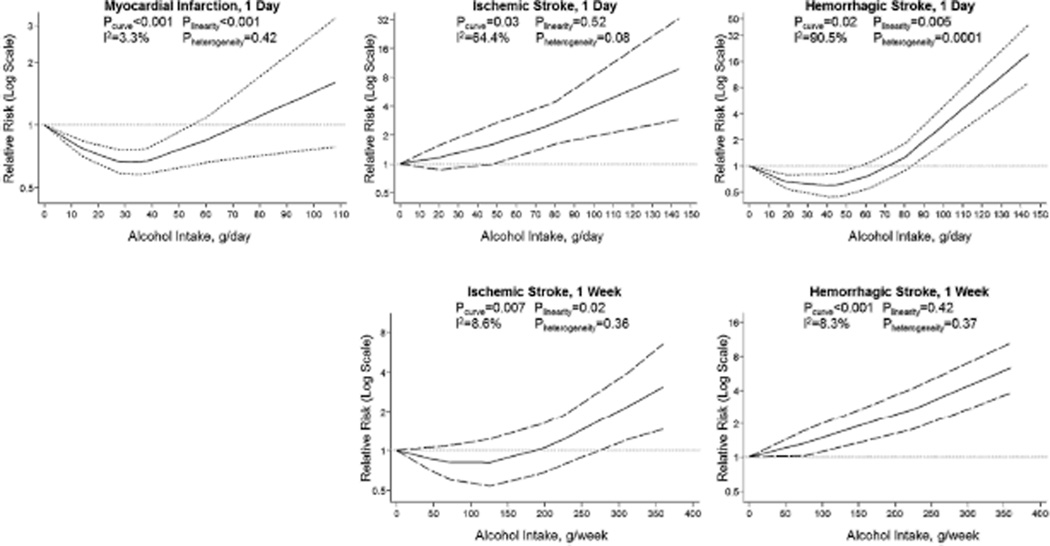
Figure 4.
Relative risk (solid line) and 95% confidence interval (dashed lines) for the association between grams of alcohol and risk of cardiovascular events within 24 hours. Alcohol consumption was modelled with restricted cubic splines in a random-effects dose–response model. The lowest value of zero (non-drinkers) was used to estimate all relative risks. The vertical axis is on a log scale. The dotted line indicates the value for no association.

